
Search “workers comp cost by state” and you get a hundred pages of averages with no methodology behind them. The honest version is narrower and more useful: on the only rigorous 50-state comparison anyone publishes, the spread between the most and least expensive state is about 5 to 1. The spread between two employees sitting in the same building in the same state is closer to 69 to 1.
That second number is the one that sets your bill. Your state matters. Your class codes matter roughly fourteen times more.
Below is the full 51-jurisdiction ranking, the arithmetic that turns a published rate into a premium invoice, and the cases where the state rankings reverse depending on who you employ.
Definition Box
Workers’ compensation insurance: A state-mandated policy that pays medical costs and partial lost wages for employees injured on the job, in exchange for the employer’s immunity from most injury lawsuits. That trade is called the exclusive remedy.
Manual rate: The published price per $100 of annual payroll for a single job classification in a single state, before any credits.
Index rate: A normalized figure that lets you compare states. Oregon’s Department of Consumer and Business Services calculates a manual rate for each of 53 occupational classes in all 51 jurisdictions, then weights every state’s rates by Oregon’s own payroll distribution. Holding the industry mix constant is what makes the comparison valid.
Experience modification factor (EMR or e-mod): A multiplier, usually between 0.75 and 1.50, that adjusts your premium up or down based on your claims history against the expected loss for businesses of your size and class.
Loss cost multiplier (LCM): The factor an individual insurer applies to bureau-published pure premiums to cover its expenses, taxes and profit. Two carriers quoting the same class in the same state will use different LCMs.
The short answer
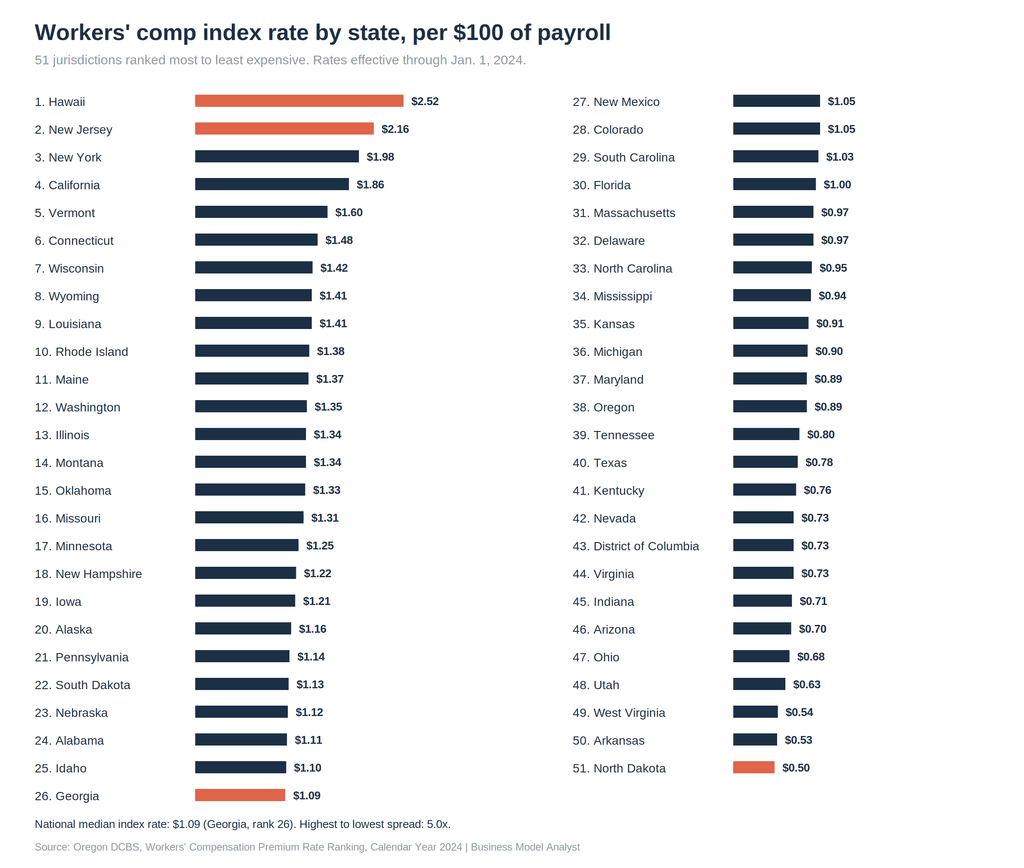
Employers in Hawaii pay the highest workers’ compensation rates in the country and employers in North Dakota pay the lowest. The national median sits at $1.09 per $100 of payroll, which is the lowest reading since Oregon started running the study in 1986 and about a quarter of the 1994 peak of $4.35.
| Measure | Figure | Source |
|---|---|---|
| Most expensive jurisdiction | Hawaii, $2.52 per $100 of payroll | Oregon DCBS, 2024 study |
| Least expensive jurisdiction | North Dakota, $0.50 | Oregon DCBS, 2024 study |
| National median | $1.09 (Georgia, rank 26) | Oregon DCBS, 2024 study |
| Highest-to-lowest spread | 5.0x | Calculated |
| Median gap between office and roofing rates inside one state | 69x | Calculated |
| Average employer cost, all private industry | $0.42 per hour worked, 0.9% of total compensation | BLS ECEC, March 2026 |
| Industry combined ratio, 2025 | 91% (12th straight underwriting gain) | NCCI 2026 State of the Line |
One caution before the table. The index rate is a comparison instrument, not a quote. It tells you how expensive Missouri is relative to Kansas. It does not tell you what your policy will cost, because it holds the industry mix constant on purpose and it excludes experience mods, premium discounts, deductible credits, schedule credits and dividends.
Workers’ comp insurance cost by state, 2026
Rates below are effective through January 1, 2024, from the most recent edition of the Oregon study, published June 2025. The study runs every two years.
| Rank | State | Index rate per $100 payroll | Percent of national median | Prior rank (2022) |
|---|---|---|---|---|
| 1 | Hawaii | $2.52 | 231% | 2 |
| 2 | New Jersey | $2.16 | 198% | 1 |
| 3 | New York | $1.98 | 182% | 4 |
| 4 | California | $1.86 | 170% | 3 |
| 5 | Vermont | $1.60 | 147% | 6 |
| 6 | Connecticut | $1.48 | 135% | 10 |
| 7 | Wisconsin | $1.42 | 130% | 8 |
| 8 | Wyoming | $1.41 | 130% | 7 |
| 9 | Louisiana | $1.41 | 129% | 5 |
| 10 | Rhode Island | $1.38 | 127% | 11 |
| 11 | Maine | $1.37 | 125% | 9 |
| 12 | Washington | $1.35 | 123% | 24 |
| 13 | Illinois | $1.34 | 123% | 19 |
| 14 | Montana | $1.34 | 122% | 15 |
| 15 | Oklahoma | $1.33 | 122% | 17 |
| 16 | Missouri | $1.31 | 120% | 13 |
| 17 | Minnesota | $1.25 | 114% | 12 |
| 18 | New Hampshire | $1.22 | 112% | 18 |
| 19 | Iowa | $1.21 | 110% | 14 |
| 20 | Alaska | $1.16 | 106% | 21 |
| 21 | Pennsylvania | $1.14 | 105% | 26 |
| 22 | South Dakota | $1.13 | 103% | 25 |
| 23 | Nebraska | $1.12 | 103% | 29 |
| 24 | Alabama | $1.11 | 101% | 20 |
| 25 | Idaho | $1.10 | 101% | 16 |
| 26 | Georgia | $1.09 | 100% | 31 |
| 27 | New Mexico | $1.05 | 96% | 27 |
| 28 | Colorado | $1.05 | 96% | 41 |
| 29 | South Carolina | $1.03 | 94% | 22 |
| 30 | Florida | $1.00 | 92% | 28 |
| 31 | Massachusetts | $0.97 | 89% | 32 |
| 32 | Delaware | $0.97 | 89% | 23 |
| 33 | North Carolina | $0.95 | 87% | 30 |
| 34 | Mississippi | $0.94 | 86% | 39 |
| 35 | Kansas | $0.91 | 83% | 35 |
| 36 | Michigan | $0.90 | 82% | 38 |
| 37 | Maryland | $0.89 | 82% | 33 |
| 38 | Oregon | $0.89 | 82% | 42 |
| 39 | Tennessee | $0.80 | 73% | 34 |
| 40 | Texas | $0.78 | 72% | 43 |
| 41 | Kentucky | $0.76 | 70% | 46 |
| 42 | Nevada | $0.73 | 67% | 37 |
| 43 | District of Columbia | $0.73 | 67% | 40 |
| 44 | Virginia | $0.73 | 67% | 36 |
| 45 | Indiana | $0.71 | 65% | 48 |
| 46 | Arizona | $0.70 | 64% | 44 |
| 47 | Ohio | $0.68 | 63% | 47 |
| 48 | Utah | $0.63 | 57% | 45 |
| 49 | West Virginia | $0.54 | 49% | 50 |
| 50 | Arkansas | $0.53 | 48% | 49 |
| 51 | North Dakota | $0.50 | 45% | 51 |
Read the middle of that table with suspicion. Across the 26 jurisdictions ranked 13th through 39th, the average difference between one rank and the next is two cents. Colorado climbed thirteen places between 2022 and 2024 without anything dramatic happening to Colorado. Rank movement in the compressed middle tells you almost nothing.
The percent-of-median column is the more stable read. Hawaii at 231% and North Dakota at 45% are structural positions. Kansas at 83% will still be near 83% in two years.
How your premium gets built
The published rate is the first term in a chain, and it is the term you control least.
Step 1. Split your annual payroll by job classification. NCCI maintains roughly 700 codes and administers ratemaking for 35 states plus the District of Columbia. Nine jurisdictions run their own independent bureaus, and four run monopoly state funds.
Step 2. For each class, multiply payroll divided by 100 by the manual rate.
Step 3. Multiply the total by your experience mod. A contractor with three lost-time claims in the past three years can carry a 1.35 mod, which adds 35% to the entire bill.
Step 4. Apply the carrier’s loss cost multiplier, schedule credits, premium discounts for size, and any deductible credit.
Step 5. Add state assessments. Oregon layers a 9.8% premium assessment on top of the premium plus a Workers’ Benefit Fund charge of 1.8 cents per hour worked in 2026. Every state does some version of this, and the Oregon study folds these into the rates for nineteen jurisdictions.
Steps 3 and 4 are where two competitors in the same city with the same class codes end up 40% apart. The state ranking sits entirely inside step 2.
The class code gap dwarfs the state gap
Take the two extremes of the Oregon study’s own class list: clerical office employees (code 8810) and roofing (code 5551).
Nationally, clerical rates run from $0.04 in Massachusetts and Washington to $0.48 in Hawaii. Roofing runs from $1.18 in North Dakota to $28.84 in Georgia. Inside a single state, the median gap between those two codes across all 51 jurisdictions is 69 to 1.
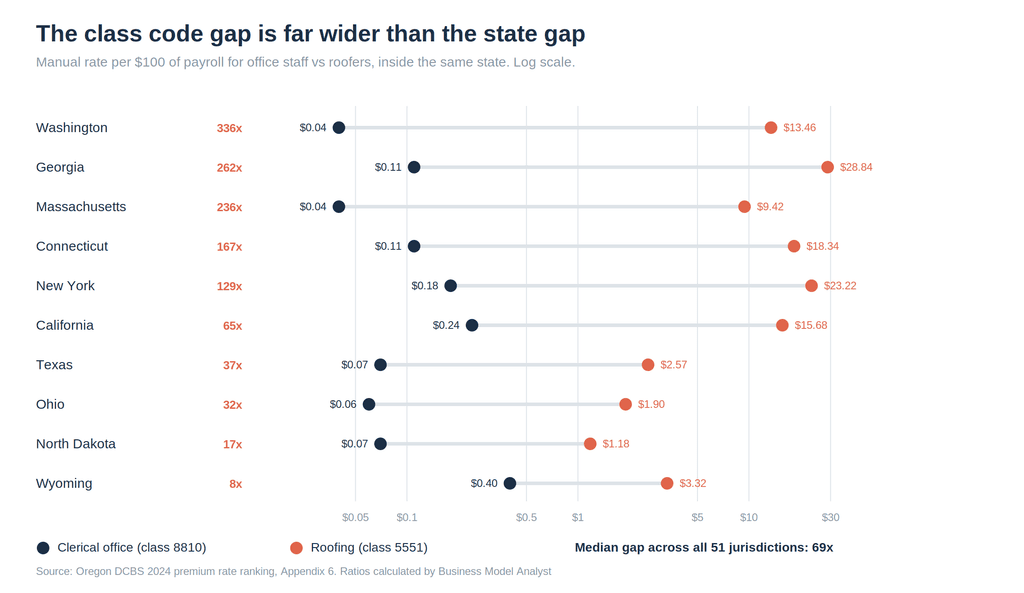
Georgia charges 262 times more for a roofer than for the bookkeeper who invoices the roofing job. Connecticut charges 167 times more. The entire distance from the cheapest state in America to the most expensive one is 5 times.
Run it as a payroll model. A residential roofing company with ten roofers at $55,000 each and three office staff at $60,000 each pays, on published manual rates before any credits:
| State | Overall rank | Annual manual premium |
|---|---|---|
| Georgia | 26 | $158,818 |
| New York | 3 | $128,034 |
| Hawaii | 1 | $99,974 |
| California | 4 | $86,672 |
| New Jersey | 2 | $35,561 |
| Texas | 40 | $14,261 |
| North Dakota | 51 | $6,616 |
The median-cost state bills that roofer 4.5 times what the second most expensive state in the country bills him.
Where the state rankings reverse
Georgia ranks 26th overall and first in the nation for roofing. New Jersey ranks 2nd overall and 32nd for roofing. Wyoming ranks 8th overall and 42nd for roofing, a 34-place move.
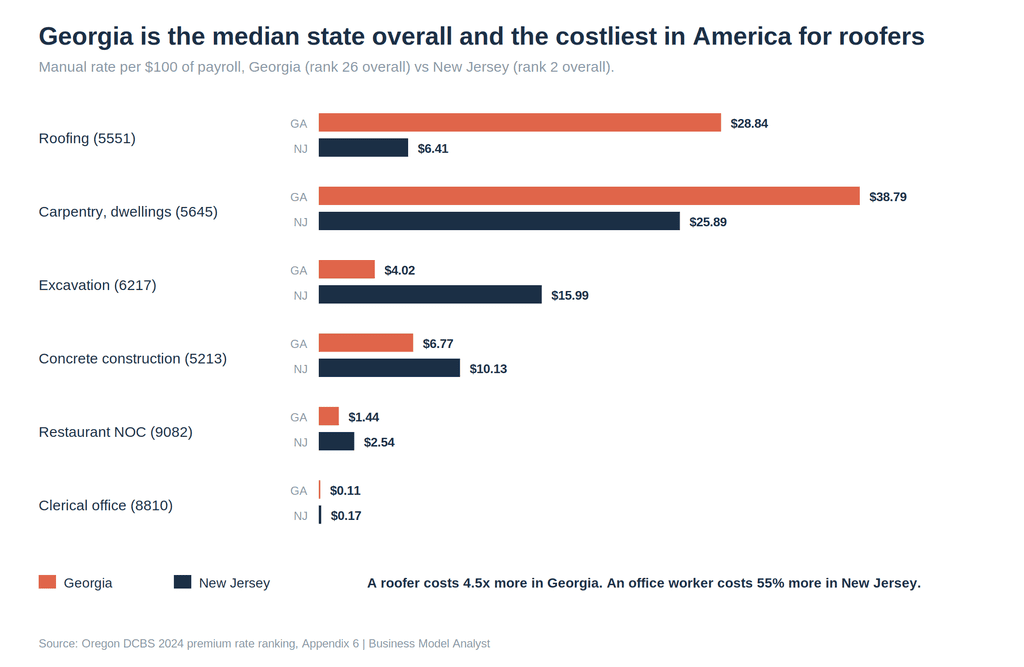
Now take the same two states and change the payroll mix. Thirteen office employees at $60,000, no field crew:
- Georgia: $858 per year
- New Jersey: $1,326 per year
New Jersey costs 55% more. Same two states, opposite conclusion, driven by nothing but which codes your payroll sits in.
Wyoming shows the mechanism from the other direction. Its monopoly state fund charges the identical $3.32 manual rate for nine separate construction classes: roofing, plumbing, electrical wiring, painting, HVAC installation, cabinet and trim carpentry, general carpentry, concrete and cement work, and excavation. NCCI states price those trades separately because their loss experience differs. Wyoming pools them. Its roofing-to-clerical gap is 8 to 1 against a national median of 69 to 1, and its clerical rate of $0.40 is the second highest in the country.
Wyoming’s office workers subsidize its roofers. That is a policy choice, and it is invisible in any ranking that reports one number per state.
The five states that break the model
North Dakota, Ohio, Washington and Wyoming operate monopoly state funds. Private carriers cannot write workers’ comp there. Ohio and Washington permit large employers to self-insure; North Dakota and Wyoming do not. Comparisons involving these four carry extra noise. Washington quotes hourly rates rather than payroll rates, and the Oregon researchers flag that converting them probably understates Washington’s effective payroll rate, because the payroll data includes overtime. Nevada and North Dakota cap premium-bearing payroll per employee per year, so salary above the cap escapes the calculation.
Texas is the only state where private employers can decline coverage outright. Employers who opt out are non-subscribers, and they surrender the exclusive remedy: an injured employee sues in civil court for negligence, and the employer loses the contributory negligence, assumption of risk and fellow employee defenses. The Texas Department of Insurance’s most recent published employer participation estimates, from 2022, put subscribers at 75% of private-sector employers and 83% of private-sector employees. Non-subscription concentrates among the smallest firms, where 31% of employers with one to four employees went without coverage.
Texas ranks 40th at $0.78 partly because it is a cheap state and partly because roughly a quarter of its employers are not in the pool at all.
What is pushing the numbers down
Between 2022 and 2024, payroll-weighted industry rates fell in 49 of 51 jurisdictions, at a median of 14.3%. Hawaii and Washington were the only two that rose.
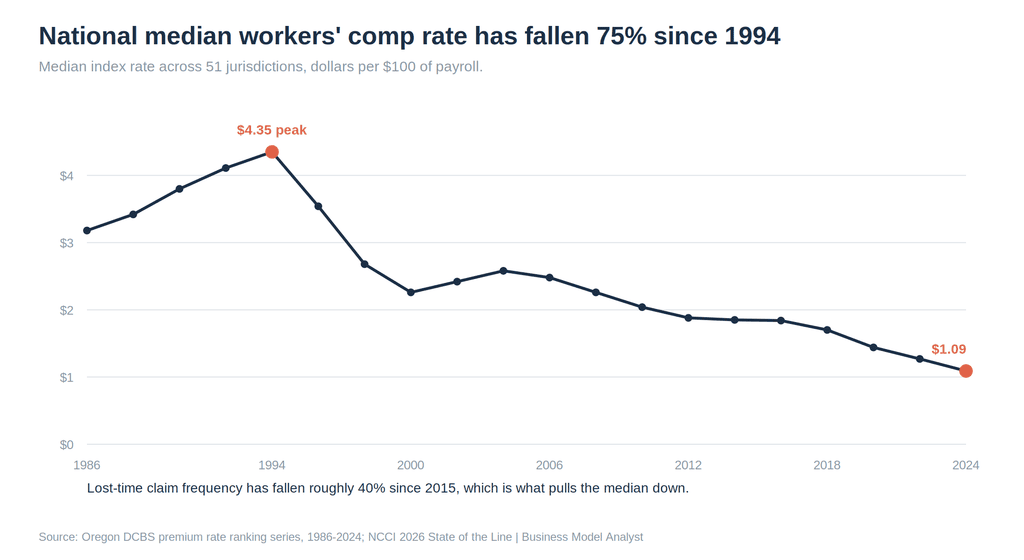
Fewer people are getting hurt. NCCI’s 2026 State of the Line reports lost-time claim frequency down about 40% cumulatively since 2015, with a 2% decline in 2025. Private carriers posted a 91% calendar-year combined ratio in 2025, their twelfth consecutive underwriting gain, and workers’ comp was the only major property and casualty line where premium shrank, down 0.2% to $41.6 billion.
Severity runs the other way. Medical and indemnity severity both grew 4% in 2025. Construction recorded the largest frequency drop of any industry between 2023 and 2024, down 7%, alongside a 13% jump in severity. Fewer claims, each one more expensive. The accident-year combined ratio was 102%, against the 91% calendar-year figure, and the gap is prior-year reserve releases. NCCI puts the remaining industry redundancy at $14 billion, down from $16 billion.
That last detail is the one to watch. Calendar-year results have been flattered by releasing reserves set aside in earlier, more expensive years. The redundancy is shrinking. When it runs out, the reported combined ratio moves toward the accident-year number, and rate decreases get harder to justify.
The public data is about to get thinner
The Bureau of Labor Statistics has published employer workers’ compensation cost inside the Employer Costs for Employee Compensation series for decades. It is dropping the measure. Beginning with December 2026 data, released in March 2027, ECEC will remove workers’ compensation. BLS gave two reasons in its February 2026 notice: the item has a substantially lower response rate than other National Compensation Survey benefits, and workers’ comp accounts for about 1% of total compensation.
The final readings, from March 2026: private industry employers paid $0.42 per hour worked for workers’ compensation, 0.9% of total compensation. State and local government paid $0.63. For scale, the same employers paid $3.41 an hour for health insurance and $1.04 for holiday pay.
The two independent series agree, which is worth noting. At $32.60 in average hourly wages, $0.42 works out to $1.29 per $100 of wages, in the same neighborhood as Oregon’s $1.09 median index rate once you account for the different denominators and class mixes.
After March 2027, the public comparators are Oregon’s biennial study and NCCI, which is the ratemaking bureau itself. Losing the independent federal read on a $41.6 billion line is a real gap, and it arrives while the reserve cushion that has been holding rates down is draining.
What to do with the rankings
If you are picking a state, price your actual class codes there rather than reading the index rank. The Oregon study publishes per-class rankings for all 53 codes in Appendix 6, free. Your broker can pull loss costs from the state bureau in an afternoon.
If you are already operating, the experience mod is the lever you own. On a $200,000 manual premium, moving from a 1.25 mod to a 0.90 mod saves $70,000, which no state relocation will match. Return-to-work programs and claim closure discipline drive the mod.
If you are buying a business, the experience mod usually transfers with the entity. A seller with a bad three-year loss run hands you a surcharge that takes three years to work off. Price it into the deal. The same discipline applies to the rest of the capital structure, which we covered in the SBA 7(a) loan mechanics guide and in how search funds work.
If your payroll is mostly clerical, stop optimizing this line. At $0.11 per $100 in Georgia, a $2 million office payroll costs $2,200 a year. Your time is better spent on health insurance, which runs about thirty times larger.
If you employ field crews, the class code assignment is worth an audit. Miscoded payroll is common, disputes are winnable, and the correction is retroactive.
Frequently asked questions
Which state has the cheapest workers’ comp insurance? North Dakota, at an index rate of $0.50 per $100 of payroll, 45% of the national median. Arkansas ($0.53) and West Virginia ($0.54) follow. North Dakota runs a monopoly state fund and caps premium-bearing payroll per employee, both of which hold the number down.
Which state is the most expensive? Hawaii, at $2.52 per $100 of payroll, 231% of the national median. New Jersey ($2.16), New York ($1.98) and California ($1.86) follow. Hawaii was one of only two states where rates rose between 2022 and 2024.
How much does workers’ comp cost per employee? BLS measured $0.42 per hour worked across all private industry in March 2026, which is roughly $875 a year for a full-time employee. That average conceals enormous variation. An office worker in Massachusetts costs a few dollars a month. A roofer in Georgia at $55,000 in wages carries about $15,900 in manual premium before credits.
Why do the state rankings change so much between studies? Because the middle of the distribution is compressed. Two cents separates one rank from the next across the middle 26 jurisdictions. Oregon’s own researchers advise reading a state’s percent of the median rather than its rank, and the researchers note that Oregon’s own drop from 42nd to 38th reflected other states cutting faster, not Oregon costs rising.
Is workers’ comp required in every state? Texas is the only state where private employers can decline it. Everywhere else it is mandatory, though thresholds vary: some states exempt employers below three or five employees, and most exempt sole proprietors and certain agricultural and domestic workers. Texas non-subscribers give up immunity from injury lawsuits.
Can I lower my premium without moving? Yes, and the levers are larger than the geography. The experience mod swings the whole bill by tens of percent. Correct class code assignment, deductible credits, schedule credits and carrier selection all move the number. Two carriers quoting identical class codes in the same state apply different loss cost multipliers.
Are rates going up or down in 2026? Down, in most states, for the thirteenth or fourteenth consecutive year in many of them. Connecticut approved a 3.8% average loss cost decrease for 2026 and Texas accepted the same 3.8% average decrease effective July 1, 2026. Oregon’s pure premium rate fell for a thirteenth straight year. Whether that continues depends on how long the reserve redundancy lasts against 4% annual severity growth.
The Business Model Analyst Take
The workers’ comp market is a rare thing in insurance: a line that has been getting structurally cheaper for thirty years because the underlying risk shrank. American workers get hurt far less than they did in 1994, and a 75% drop in the median rate is the price signal for that. Carriers have booked twelve straight years of underwriting profit on a shrinking premium base, which is the mark of a mature, well-priced line rather than a broken one.
The state ranking is the wrong unit of analysis for anyone buying the product. It exists because Oregon needed a defensible way to argue about its own competitiveness in 1986, and it does that job well. Applied to an individual employer, it collapses a 69-to-1 class dimension into a 5-to-1 state dimension and then reports the smaller number as the headline. Georgia sitting at exactly the national median while charging the highest roofing rate in America is the clearest illustration of the problem.
Two things worth watching. The reserve redundancy that has been subsidizing calendar-year results fell from $16 billion to $14 billion in a year, and the accident-year combined ratio already sits at 102%. When that cushion runs out, the thirteen-year run of rate decreases ends, and states will diverge based on how their benefit design and medical fee schedules absorb 4% severity growth. And the BLS is walking away from the only independent federal measure of what employers pay, right before that turn. The next edition of the Oregon study, using January 2026 rates, becomes materially more important than the last one.
For anyone modeling labor cost, the practical conclusion holds regardless: workers’ comp is 0.9% of total compensation and health insurance is 7.3%. Spend your attention accordingly, unless you employ people who work on roofs.
Sources: Oregon Department of Consumer and Business Services, “Oregon Workers’ Compensation Premium Rate Ranking, Calendar Year 2024” (June 2025), including Appendix 2 and Appendix 6; NCCI 2026 State of the Line Report and Guide (May 2026); U.S. Bureau of Labor Statistics, Employer Costs for Employee Compensation, March 2026 (released June 12, 2026) and the ECEC notice on removing workers’ compensation costs (February 12, 2026); Texas Department of Insurance, Division of Workers’ Compensation Research and Evaluation Group, “Employer Participation in the Texas Workers’ Compensation System: 2022 Estimates” (April 2023); Oregon DCBS 2026 rate notice and premium assessment filing. Ratio and payroll-model calculations by Business Model Analyst.