

At the top of the tech market, compensation no longer tracks job title first. It tracks strategic scarcity. OpenAI's median total compensation is about $875,000, with senior roles exceeding $1.3M, while Microsoft engineering levels average $200,000 to $400,000 and Amazon averages $260,000 to $380,000, according to daily.dev's 2026 developer salary benchmarks. That spread is too large to explain with “big tech pays well.” It reflects different business models, capital structures, and talent priorities.
That's why tech salaries compared across major companies are more useful as a strategic signal than as a shopping list. Pay tells you which firms are buying research velocity, which are optimizing for scalable execution, which are using equity to defer cash burn, and which are competing on operational efficiency rather than frontier innovation.
Early in the analysis, it helps to anchor the market with a compact benchmark.
| Company tier | Example companies | Typical total compensation (USD) |
|---|---|---|
| Frontier AI and top-end outliers | OpenAI, Netflix, Databricks, NVIDIA, quant firms such as Citadel and Jane Street | OpenAI median about $875,000, senior roles above $1.3M; Netflix top roles about $1.2M+; Databricks staff+ $1M+; NVIDIA AI-focused roles $400,000 to $500,000+; quant firms $500,000 to $1,000,000+ |
| Large-cap tech leaders | Microsoft, Amazon, FAANG average | Microsoft $200,000 to $400,000; Amazon $260,000 to $380,000; FAANG average $350,000+ |
| General senior US engineering market | Senior backend, senior frontend, senior general developers | Backend $185,000 to $260,000; frontend $160,000 to $220,000; senior general developers $185,000 to $260,000 |
| Western Europe senior market | UK and Germany averages, senior DevOps and cloud platform work | Senior developers $80,000 to $140,000; senior DevOps/SRE €85,000 to €160,000 |
Decoding the Tech Compensation Landscape in 2026
FAANG compensation now clears the broader software market by a wide margin. Earlier benchmarks in this article put FAANG average total compensation above $350,000, versus roughly $115,000 for software developers outside top-paying tech employers, and they also show a meaningful premium for AI and ML talent. The board-level question is what those gaps buy.
Compensation is the price of a company's operating model. A frontier AI lab pays for research throughput and model quality. A scaled platform company pays to reduce failure risk across products with large cash flows. A startup often uses equity to shift part of compensation into future upside, which preserves cash but raises the retention burden if growth stalls.
Pay now signals strategic intent
Three patterns matter.
- High cash and high equity usually indicate concentrated value creation: If one engineer can improve model performance, ad yield, trading output, or core infrastructure reliability, paying above market can produce a strong return on talent.
- Premium pay at mature companies often reflects risk control: Firms with durable revenue streams can justify higher compensation because execution mistakes are expensive, public, and hard to reverse.
- Discounted cash packages usually require another advantage: That may be faster promotion, stronger equity upside, unusually flexible work, or a mission that attracts scarce specialists despite lower near-term pay.
This is why salary tables alone are incomplete. Two companies can post the same base salary for a senior engineer and still be making very different bets on speed, dilution, management discipline, and replacement cost.
For directors, the practical implication is simple. If the business depends on a narrow set of technical decisions, underpaying those roles does not create efficiency. It increases product risk, slows execution, and can weaken the moat the company is trying to build.
Candidates should read offers the same way. A package is a statement about risk allocation and expected value, not just cash plus stock. For anyone assessing startup offers, Underdog's guide to mastering startup compensation packages is a useful reference because it explains how salary, equity, and benefits shift the economics of an offer.
A Rigorous Methodology for Comparing Salaries
Salary comparisons break down when analysts treat unlike firms as interchangeable. A services company, a GCC, a venture-backed startup, and a frontier AI lab may all advertise for a “Senior Backend Engineer.” That title parity creates false equivalence.
The cleanest example comes from India. Service companies such as TCS and Infosys pay 20 to 40 percent below market, while Global Capability Centers can exceed local startup ranges at senior levels. In Hyderabad, a Senior Backend Engineer at a GCC commands ₹35 to 50 lakh, versus ₹18 to 24 lakh at a mid-size IT services firm, creating a $25,000 to $30,000 annual disparity according to Kaam's India tech salary report. Any benchmark that collapses those into one “market average” is analytically weak.

What a credible comparison includes
A board-ready salary comparison needs four filters.
- Company model: Product company, service provider, GCC, or research-heavy outlier.
- Role specificity: Backend, frontend, SRE, AI/ML, security, and platform work don't clear at the same price.
- Level normalization: “Senior” varies widely. L5-equivalent and staff-equivalent mapping is more useful than titles alone.
- Total compensation: Base salary matters, but it's incomplete without bonus and equity.
Why total compensation is the only serious metric
Top companies don't just pay more. They pay differently. Some push cash higher. Others shift meaningful value into equity. Others use bonus structures to align short-cycle execution. A candidate comparing a Microsoft package to an OpenAI package or a GCC offer to a startup offer needs to compare what is received over time, not just what appears in the base field.
That means every offer should be decomposed into:
- Base salary, which protects downside.
- Bonus, which often reflects annual execution discipline.
- Equity, which can create upside but also adds timing and liquidity risk.
Board lens: If your recruiting team reports that you're “near market” on base while losing candidates on total compensation, you're not near market.
The practical implication is simple. Don't benchmark against geography alone, and don't benchmark by title alone. Benchmark by company type, role scarcity, level, and pay mix. That's the minimum standard for any useful analysis of tech salaries compared across major companies.
Compensation Breakdown by Role and Level
Compensation spreads sharply once technical work is tied to revenue concentration and execution risk. A company hiring across backend, frontend, reliability, security, and AI is not buying from one labor market. It is buying from several distinct markets with different scarcity curves, replacement costs, and business impact.
The highest bands cluster around roles that either create direct product differentiation or protect expensive systems from failure. Applied AI fits the first category. SRE, platform, and security often fit the second. General software engineering still anchors large parts of the market, but it no longer defines the upper bound for senior technical pay.
Here's a visual summary of how compensation components stack up by role and level.

Role premiums map to business bottlenecks
As noted earlier, senior AI and machine learning roles in the US clear meaningfully higher total compensation than senior generalist engineering roles. That premium is not just a reflection of hype. It shows where firms believe a small number of hires can influence model quality, product speed, and investor expectations.
Frontend and backend compensation also diverge for structural reasons. Backend engineers are usually closer to data systems, service reliability, integrations, and performance constraints that touch both customer experience and operating cost. Frontend work remains highly valuable, but many companies face a deeper shortage in backend and distributed systems talent than in UI implementation. Pay follows that scarcity.
Boards should treat these gaps as signals, not noise. If one role family clears a persistent premium across employers, the market is identifying a bottleneck in value creation or value protection.
Level progression is steeper in scarce specialties
The jump from mid-level to senior is material in any technical function, but the slope is steeper in specialties where ramp time is long and errors are expensive. Infrastructure is a clear example. A senior reliability engineer can influence release velocity, cloud spend, incident frequency, and enterprise trust in a way that a less experienced hire often cannot.
That changes how headcount planning should work. A finance team that assumes one senior engineer can be replaced by two mid-level hires at similar output usually underestimates coordination cost and overestimates substitutability. In AI, security, and SRE, the market often prices judgment as much as coding throughput.
A practical view of the hierarchy looks like this:
| Role | Market position at senior level |
|---|---|
| AI/ML engineer | Commands a premium where model deployment and data advantage shape product strategy |
| Backend engineer | Prices above generalist bands when systems complexity and integration load are high |
| Frontend engineer | Remains strong, but often below backend and AI unless product UX is the core differentiator |
| DevOps/SRE | Gains premium treatment where uptime, release speed, and cloud efficiency affect margin |
| General software engineer | Sets the baseline in many firms, but no longer represents the ceiling |
Why infrastructure pay is rising faster than many boards expect
Infrastructure hiring often appears in budgets as support cost. In practice, it functions more like operating insurance with upside. Reliability teams reduce outage risk. Platform teams lower developer friction and improve deployment speed. Cloud engineering can remove waste from one of the largest variable cost lines in software businesses.
That combination gives these roles an unusual compensation logic. The company is not paying only for labor. It is paying for fewer incidents, faster shipping, and better gross margin discipline.
A role that improves uptime, deployment frequency, or cloud efficiency should be evaluated against the financial impact of those outcomes, not against a generic engineering average.
This video offers a practical complement to the numbers by breaking down how compensation components are often discussed in the market.
For candidates, the implication is clear. Negotiation power depends on role family, not just title. For employers, the implication is harder. A single compensation framework across all technical roles usually produces one of two failures: overspending on broad talent pools or underpaying in the specialties that protect product velocity and competitive moat.
Benchmarking Salaries Across Major Tech Companies
A senior engineer can cost one company roughly the same as three to five senior engineers at another. That spread is not a branding anomaly. It is a balance-sheet signal about where each business expects technical talent to create economic advantage.
The useful comparison is strategic tier, not household-name prestige. Companies at the top of the pay curve are usually buying one of three things: scarce research capability, direct impact on revenue or margins, or unusually high tolerance for talent concentration. That is why frontier AI labs, top data infrastructure firms, selected media platforms, and quant trading houses often sit in the same compensation conversation even though their products look unrelated.
A tiered view is more useful than a rank order
Using a senior engineer or L5-equivalent lens keeps the comparison focused on the level where companies make large, repeatable hiring bets.
| Company tier | Example companies | Typical total compensation (USD) |
|---|---|---|
| Tier 1 frontier and performance-maximizing firms | OpenAI, Databricks, Netflix, top quant firms, NVIDIA AI-focused roles | As noted earlier, these companies set the top end of the market, with total compensation often far above standard big-tech bands and, in some cases, reaching seven figures at higher levels |
| Tier 2 premium large-scale platforms | Amazon, Microsoft, broader FAANG | High but more standardized pay bands, usually tied to formal leveling systems, equity refresh cycles, and manager-calibrated ranges |
| Tier 3 broader senior engineering market | Senior backend and frontend roles across the US market | Competitive six-figure compensation, but generally with narrower upside and less aggressive equity economics than Tier 1 or Tier 2 firms |
The ranking matters less than the compensation design. Tier 1 firms often accept pay dispersion because a small number of hires can change product performance, model quality, trading returns, or infrastructure economics. Tier 2 firms optimize for scale. They need thousands of capable engineers operating inside controlled compensation systems. Tier 3 employers usually compete on team scope, flexibility, stability, or location-adjusted value rather than absolute cash and equity.
What the gaps reveal about corporate economics
High compensation is easiest to justify when output is nonlinear.
An AI lab can rationalize extreme pay if one researcher or systems engineer improves training efficiency, inference cost, or product quality enough to affect enterprise value. A quant firm can do the same when a small team improves execution, pricing, or signal generation. Netflix-style compensation logic comes from a different source. It emphasizes very high talent density and fewer managerial layers, which supports higher individual pay because the organization is designed around concentrated accountability.
Scaled platform companies face a different constraint. They need compensation structures that attract strong talent without breaking internal equity across large organizations. That usually produces narrower bands, more predictable refresh practices, and stricter level calibration. Boards should read that as an operating choice, not a lack of willingness to pay.
Salary bands reflect a company's production model. They show whether the firm wins through concentrated expertise, scaled execution, or cost discipline.
This matters for governance. If leadership says engineering is the moat but compensation sits near the middle of the market for the roles that protect uptime, model quality, or developer productivity, the company is funding its stated strategy below the level its competitors may be using.
Why title matching fails across companies
A “Senior Engineer” title is not portable without context. The same label can describe very different expectations in architecture ownership, revenue exposure, and replacement difficulty.
A better board-level comparison starts with four questions:
- How tightly is the role tied to economic output? Revenue, retention, cloud spend, reliability, and shipping speed matter more than title.
- How scarce is the skill set? Research talent, low-latency systems expertise, and top-tier ML infrastructure remain thin labor markets.
- How expensive is a miss? Slow ramp time or weak execution can delay launches, increase incident risk, or raise infrastructure costs.
- What management model surrounds the role? Companies with high talent density and fewer layers can support higher pay per head.
Those questions also explain why return-to-office policies can alter effective pay competitiveness. Firms that narrow geographic flexibility often need to compensate with stronger cash, equity, or brand advantage, especially in expensive labor markets. The organizational politics behind those mandates are examined in this analysis of why bosses mandate RTO and what it signals about management incentives.
For candidates, this section changes the benchmark. Compare offers by expected business impact, not title. For employers, the implication is sharper. If cash compensation cannot match the top tier, the offer must win somewhere else, such as equity asymmetry, narrower role scope with better work-life economics, or location arbitrage. For some distributed teams, even lifestyle-adjusted value can become part of the offer narrative, especially for candidates already budgeting for remote work in Madeira.
Analyzing Geographic Pay Gaps and Remote Work
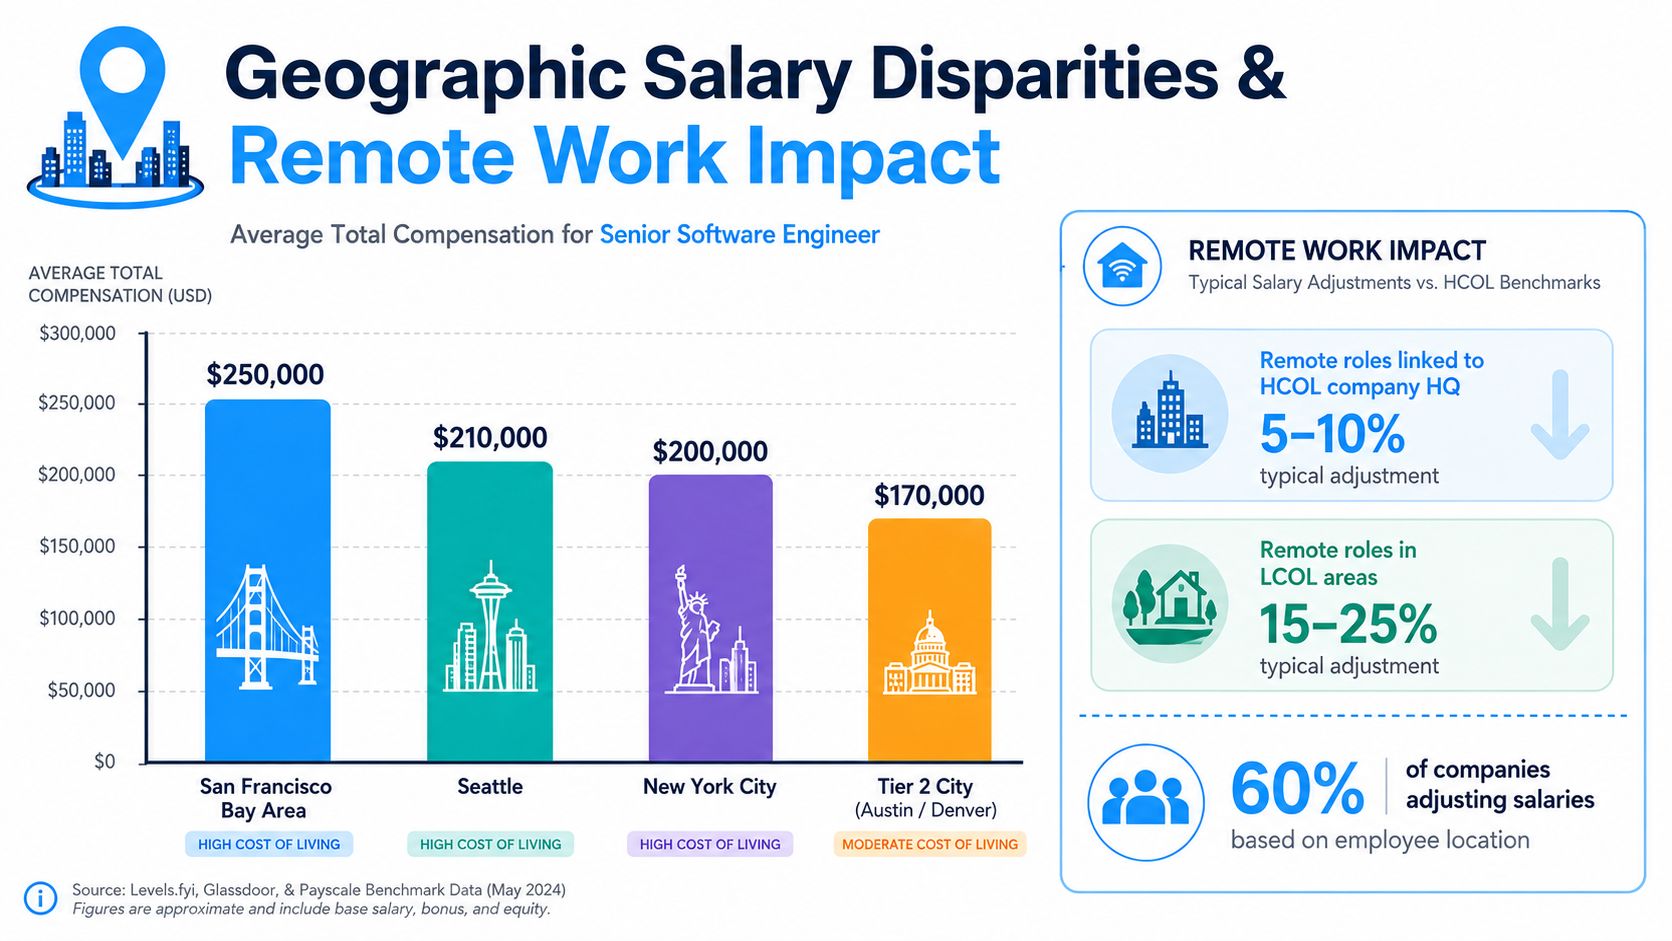
Geography still creates material pay dispersion in tech. Remote hiring widened the talent pool, but it did not create a single global clearing price for engineers. What emerged instead is a layered market where companies pay for three different things at once: skill scarcity, local replacement cost, and the operating model they want to sustain.
As noted earlier, senior engineers in major US hubs still command meaningfully higher pay than comparable roles across much of Western Europe. That spread matters less as a trivia point than as a strategic constraint. A company that centralizes leadership, product decisions, and architecture in high-cost hubs is making a deliberate cost tradeoff. It is paying more per employee to increase coordination speed, tighten management oversight, and keep core talent close to revenue-critical teams.
Remote work changes the market boundary, not the market logic
Remote work expanded where companies can hire. It did not remove the premium attached to hard-to-replace skills or to employees embedded in headquarters functions.
That distinction is easy to miss. Firms often describe remote compensation as a fairness decision, but the harder question is economic. Are they paying for the role's output, the employee's local labor market, the norms of a flagship office, or a blended benchmark designed to avoid internal compression? Each choice produces a different talent map. It also produces a different margin profile.
A remote-first company can spread hiring across lower-cost regions and reduce payroll concentration in San Francisco, Seattle, or New York. That can improve cost efficiency. It can also weaken mentoring density, slow decision cycles, or create promotion friction if management systems were designed for co-located teams. The savings are real only if productivity, retention, and execution quality hold.
Cost of living is a retention variable. Cost of labor is a hiring variable.
Boards should keep those concepts separate. Employees experience compensation through purchasing power. Recruiters experience compensation through acceptance rates and time-to-fill. The two overlap, but they are not interchangeable.
This is why location-based pay formulas often break down for specialized technical roles. A staff engineer with rare distributed systems expertise does not become easy to hire because they live in a cheaper city. The company may save on benchmarked cash compensation, but the labor market for that skill remains national or global. In practice, scarcity travels with the worker.
For candidates, the upside can be large if they secure strong remote compensation while reducing personal expenses. Anyone comparing real purchasing power across locations can pressure-test that math by budgeting for remote work in Madeira.
Lower local expenses can improve employee economics. They do not automatically reduce the market rate for scarce technical talent.
Return-to-office policy is also a compensation signal
Office mandates are often framed as culture or collaboration decisions. They also reveal how management values supervision, informal coordination, and headquarters influence relative to payroll flexibility. Companies that insist on hub-based attendance frequently need stronger cash compensation, better promotion visibility, or brand prestige to offset the narrower labor pool.
That is one reason the debate over why some bosses mandate RTO and what it signals about management incentives belongs in any serious compensation analysis. An office requirement is not just a workplace policy. It is a pricing decision that changes who will join, who will stay, and which functions can be staffed efficiently outside core hubs.
For directors, the practical question is narrower than “remote or office?” It is which roles are best served by geographic concentration, and which roles can be distributed without raising execution risk. Companies that answer that question precisely usually hire faster and spend more intentionally. Companies that answer it with blanket rules usually overpay in some roles and underinvest in others.
How Compensation Strategy Reflects Business Models
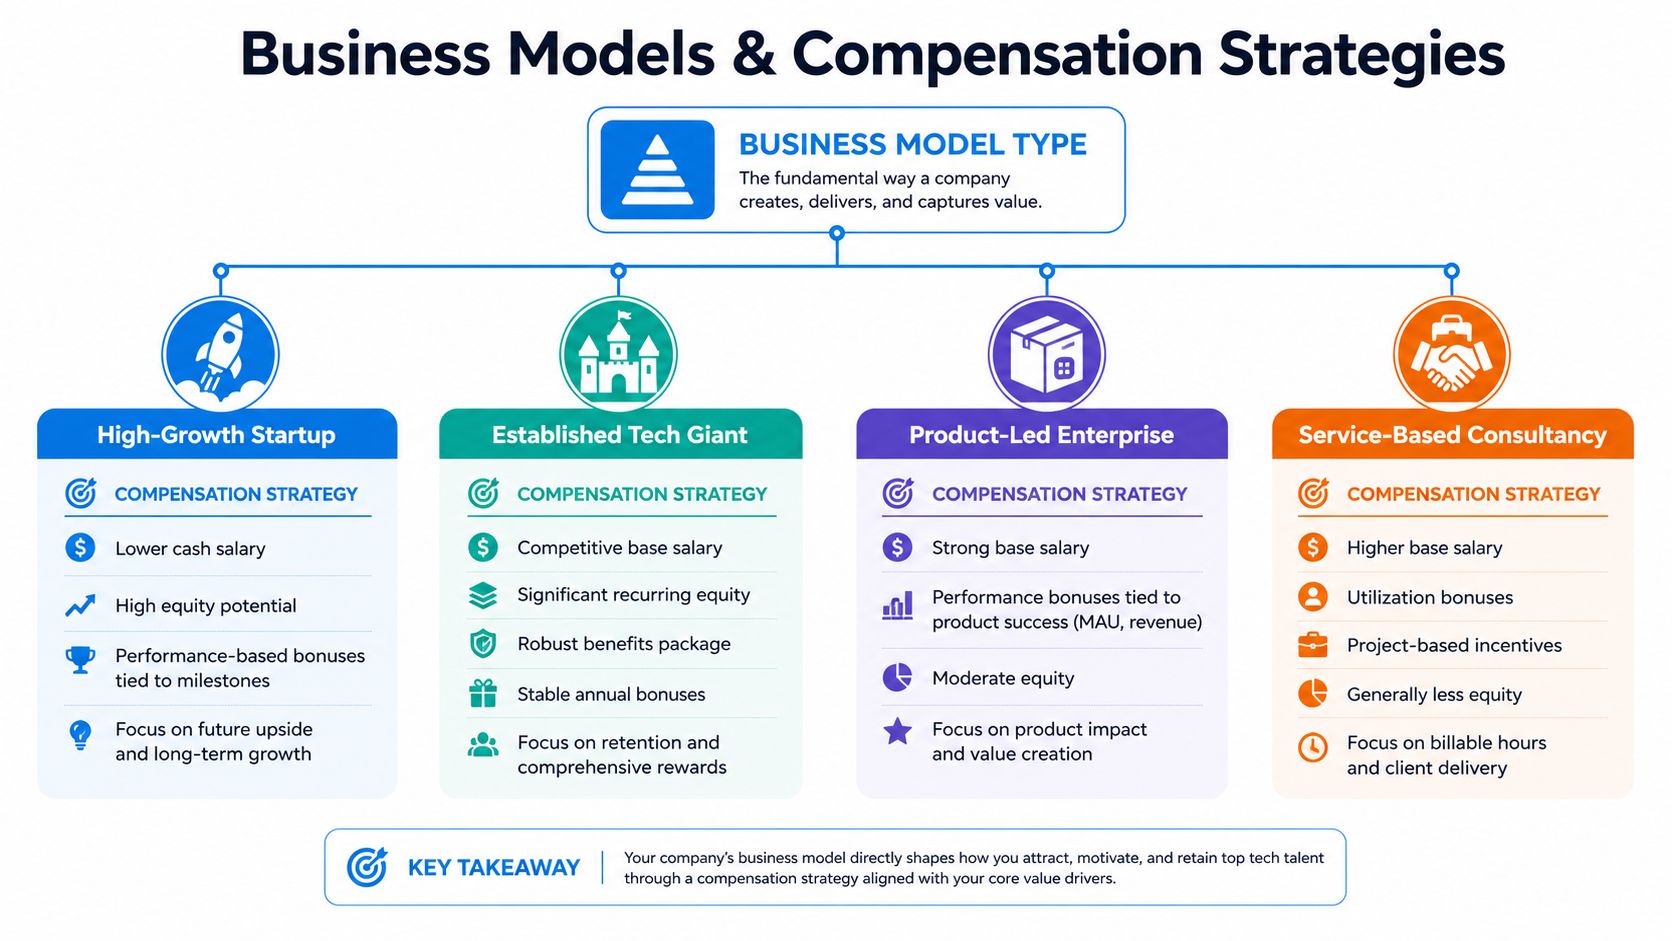
Compensation design is one of the clearest fingerprints of a company's business model. Firms don't just pay what the market demands. They choose structures that support how they create value, absorb risk, and retain key talent.
The strongest proof sits in the pay mix. Equity constitutes 25 to 31 percent of total compensation and has grown 42 percent year over year, while base salaries only grew 18 percent. At the same time, laid-off workers from major tech firms see wages drop 10 to 15 percent upon rehiring, and entry-level salaries have decreased 20 percent in less specialized positions due to AI displacement and outsourcing, according to Second Talent's compensation analysis. That tells directors two things. First, equity has become a larger strategic lever. Second, downside risk has become more uneven across roles.
Cash-heavy and equity-heavy models send different signals
A high-cash model usually indicates that management values immediate attraction and low ambiguity. That tends to fit firms with durable cash generation, high productivity expectations, and limited patience for ramp time.
An equity-heavier model can be rational for companies that need to conserve cash, align employees with long-term value creation, or recruit people willing to underwrite company risk. But equity only works as a retention instrument if employees believe the future value is both material and realizable.
The hidden issue is realized value
Many board conversations often remain too abstract. Accounting value and employee value aren't the same. If equity is a larger share of pay, then vesting schedules, liquidity windows, and volatility matter more. A company can look generous on paper while feeling disappointing to employees in practice.
That gap becomes larger after layoffs or repricing events. If workers face lower wages when re-entering the market, compensation strategy isn't just a recruiting tool. It becomes part of employer brand recovery and retention psychology.
Decision rule: If your company uses equity as a major compensation lever, directors should evaluate not just grant size but the employee's likely ability to convert that grant into realized value.
Different business models justify different pay philosophies
Here's the strategic mapping boards should apply:
- Frontier R&D businesses: Pay aggressively for rare talent because output is concentrated and the upside from a small team can be extreme.
- Scaled product platforms: Use strong recurring compensation to maintain execution quality across large product systems.
- Service and delivery businesses: Keep compensation closer to billable economics and margin discipline.
- High-growth startups: Trade some cash for equity upside, but only if the narrative remains credible.
This is the same logic you can see in mature platform businesses such as Google, where the economics of scale, product ecosystem control, and talent density reinforce one another. A business-model view of how Google creates and captures value makes compensation easier to decode because pay becomes one mechanism inside a larger strategic system.
Actionable Advice for Candidates and Employers
For candidates, the most important move is to stop comparing offers by title and start comparing them by market segment. A “Senior Engineer” offer from a services firm, a GCC, a public tech company, and an AI lab can represent completely different economic realities. Ask three questions: What is the company type, how much of the package is at risk, and how scarce is your role family in this market?
A useful decision framework looks like this:
- Benchmark the role, not the label: Compare yourself to backend, frontend, SRE, AI/ML, or security peers, not to a generic engineering average.
- Price downside before upside: Base salary protects your floor. Equity may raise your ceiling, but it can't pay your obligations until it becomes liquid.
- Look for business-model fit: If the company's economics don't support the package, future compression risk is high.
For employers, compensation strategy should start with operational productivity, not with a broad “pay at percentile X” target. If a role directly shapes uptime, security, model performance, or core product velocity, treat that role as strategic infrastructure. If a role is easier to substitute, use broader ranges and stronger performance management instead of chasing outlier offers.
Boards should also ask whether hiring plans reflect the firm's actual future. Many companies still budget for yesterday's org chart. That's risky in a market where specialized technical talent can alter product economics and where less specialized roles are under pressure. Hiring leaders who understand both technology and business impact is part of that correction. This is why the case for why hiring tech-savvy talent is crucial for business success in 2026 is broader than recruitment. It's capital allocation.
The companies that win this market won't be the ones that just pay more. They'll be the ones that match compensation design to business design.
If you want more analysis like this, The Business Model Analyst publishes practical breakdowns of how companies make money, scale operations, and use strategic choices such as pricing, distribution, and compensation to build durable advantages.