Is Nike profitable? In a short and direct answer, yes. In 2022, the company’s gross profit was $21.896B for twelve months at the end of November. This was a 2.88% rise year over year. Nike’s annual gross profit for the same year was $21.479B, marking a 7.6% rise from 2021. As of June 2021, the company’s market capitalization was $243.9 billion. However, Nike’s net income dropped by 22% year-on-year to $1.5 billion, even with a rise in operating costs.
Reports suggest that the operating costs rose by 12% to hit $3 billion due to strategic technology investments and wage-based expenses. During that period, the gross margin dropped to 44.3% due to logistics and freight costs. The drop was also attributed to low margins in Nike’s direct business following high markdowns. In terms of the Nike brand, revenues rose by 4% to hit $12 billion.
Regardless of the flop in Greater China, the brand thrived in the Asia Pacific & Latin America, the Middle East and Africa, Europe, and North America. Phil Knight and Bill Bowerman founded Nike in 1964. In 2020, the company’s revenue was more than $37.4 billion. The company’s revenue in 2022 was $46.71 billion, marking a 4.88% increase from 2021.
Contents
Timeline of Nike’s Financial Growth and Funding
Nike’s financial growth and funding timeline stretch back to when its founders established the company in 1964. The company has leveraged PR campaigns, sleek designs, and distinguished endorsements to build a name for itself in pop-culture history. To understand Nike’s growth story, we must be conversant with Phil Knight’s story, a self-proclaimed average track runner straight out of college then, and a coach (Bill Bowerman) fascinated with the connection between design and speed. Here is a timeline of Nike’s events.
1964-1983: Phil Knight and Bill Bowerman founded Blue Ribbon Sports. Phil started out selling his imported shoes out of his car. With time, he discovered a high demand for cheaper yet high-quality alternatives to the Pumas and Adidas apparel and footwear available in the market. Bill would later approach the Tiger shoe company and propose a new shoe design with the specifications to offer runners the proper support.
The shoe hit the market in 1967, becoming a hit instantly following its stylish, sturdy, and comfortable design. In 1971, Blue Ribbon Sports cut its association with Tiger. The former would later become Nike Inc. Carolyn Davis, a Portland State University student, created the company’s swoosh logo for $35.
In 1983, having been satisfied with the logo, Phil organized a party for Carolyn, awarding her 500 shares of stock, said to be worth approximately $1 million as of 2019. The waffle trainer was one of Nike’s most successful shoes, playing a core role in the company’s growth in its initial years. The growth culminated in Nike’s 1980 initial public offering, leaving Phil with $178 million worth of shares. Since then, the company has adopted strategic ad campaigns to maintain its growth.
1984-2018: Nike signed Michael Jordan and launched Air Jordans. The company made $100 million in revenue from selling the shoes. Air Jordans have remained a consistent revenue earner for Nike despite a drop in sales. In 2018, Nike made $2.8 billion from the brand. Nike pays Michael Jordan approximately $100 million annually in royalties.
In 1991, Nike suffered a blow after Jeff Ballinger published a report exposing poor working conditions and low wages in Indonesian Nike factories. Nike would later sign Tiger Woods, Kobe Bryant, and LeBron James. The company also acquired Hurley before buying Converse for $309 million in 2004, the same year Phil resigned as president and CEO.
Nike signed Derek Jeter in 2008 and became the official NFL and NBA apparel supplier in 2012 and 2015, respectively. In 2018, the company unveiled an ad campaign featuring Colin Kaepernick, a political activist and athlete, attracting public backlash and approval.
2019-2021: Nike’s fourth quarter and annual financial performance for the year ending May 31, 2021, indicated a profit increase of 196% over 2020 and 42% over 2019. The fiscal year revenue rose by 19%, with quarter four revenue up by 96%.
According to John Donahoe, Nike’s CEO and president, “FY21 (full year 2021) was a pivotal year for NIKE as we brought our Consumer Direct Acceleration strategy to life across the marketplace. Fueled by our momentum, we continue investing in innovation and digital leadership to set the foundation for NIKE’s long-term growth.”
In 2021, Nike’s direct sales were 33% of overall revenue, with digital growth hitting $9 billion in sales to represent more than 20% of overall revenue. Donahoe highlighted the company’s commitment to attaining 50% digital business by 2025.
Nike Financial Performance: Revenues, Expenses, and Profits
Nike recently released its August 31, 2022, first-quarter financial results. The reported revenues for this period were $12.7 billion, a 4% increase compared to 2021 and a 10% rise based on currency neutrality. The company’s direct sales hit $5.1 billion, a 14% rise and an 8% rise on a currency-neutral and reported basis, respectively.
Nike’s digital sales rose 16% and 23% on a reported and currency-neutral basis, respectively, led by EMEA’s 46% growth. The gross margin dropped 220 basis points to reach 44.3%. Dilute earnings per share for the first quarter was 0.93%, a 20% drop from the previous year.
Administrative and selling expenses rose by 10% to hit $3.9 billion, while creation costs were $943 million, a 3% increase attributed to standardization of spend against the brand campaign and sports marketing investments. Operating fixed cost expenses rose by 12% to hit $3 billion. This was attributed to wage-based expenses, high Nike direct costs, and planned technology investments. The quarter’s effective rate was 19.7%, a slight increase from the previous year’s 11%. Net income dropped by 22% to hit $1.5 billion, while diluted earnings for each share were $0.93, a 20% drop.
Reported revenues for the second quarter increased by 17% to hit $13.3 billion, marking a 27% rise on a currency-neutral basis. Nike’s direct sales increased by 16% to hit $5.4 billion on a reported basis and 25% on a currency-neutral basis.
The brand’s digital sales were up 34% on a currency-neutral basis and 25% on a reported basis. Wholesale revenues were high by 30% and 19% currency-neutral and reported basis, respectively. Gross margin to 42.9% by 300 points, and diluted earnings for each share for the second quarter were up by 2%, hitting $0.85.
Commenting on the company’s second-quarter results, Donahoe said, “NIKE’s results this quarter are a testament to our deep connection with consumers. Our growth was broad-based and was driven by our expanding digital leadership and brand strength. These results give us confidence in delivering the year as our competitive advantages continue to fuel our momentum.”
Nike’s inventories rose by 43% to hit $9.3 billion, while short-term investments, equivalents, and cash were $10.6 billion, dropping by $4.5 billion from the previous year.
Nike’s most recent financial reports suggest its current revenue is $49.10 billion. The company generated $46.3 billion in revenue in 2021, a significant increase from the 2020 revenue of $38.25 billion. Nike invests colossal sums into promotional campaigns every year. In the 2022 financial year, Nike’s promotional and advertising costs were nearly $3.11 billion.
Nike has some of the best profit margins in the industry. In the 2016 fiscal first quarter, Nike reported a net income increase of 23% and a quarterly revenue increase of 5%. Nike continued to make a profit in the 2020s, despite a few drops here and there in terms of sales.
Nike Revenues
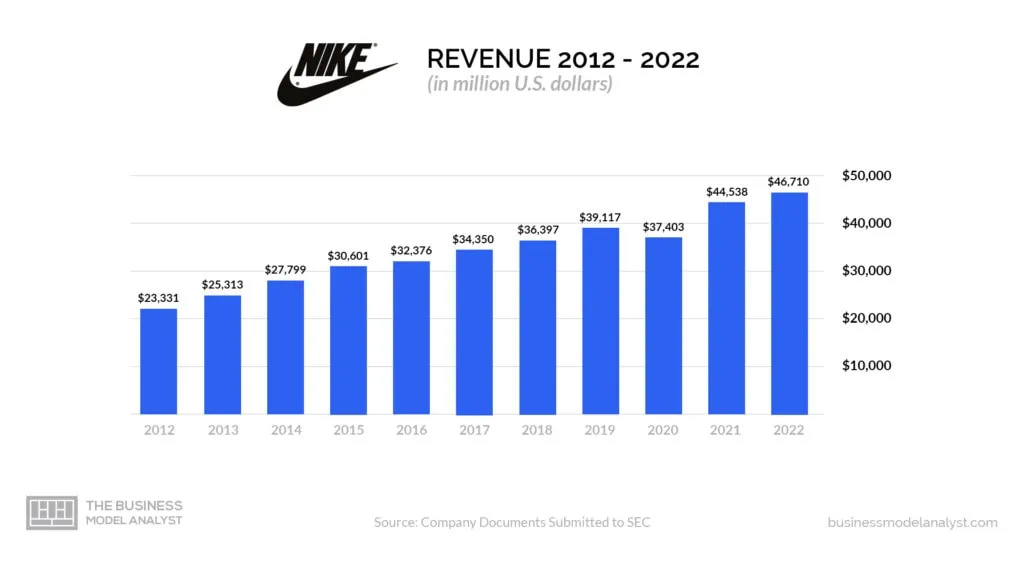
Nike ended the 2020 fiscal year with $37.4 billion in revenue, a 4% drop from 2019 due to the Covid-19 pandemic. Hurlet and Converse are Nike’s leading subsidiary brands. Converse is responsible for designing, marketing, and distributing athletic lifestyle accessories, footwear, and apparel.
Hurley is tasked with designing, marketing, and distributing youth and surf accessories, apparel, and footwear. The market changes to direct circulation in AGD and massive growth in the US drove Converse’s revenue to $1.8 billion. Nike’s revenue, exclusive of the Converse earnings, was $35.6 billion in the 2020 fiscal year. Here is a global breakdown.
- North America: 41% or $14.5 billion of overall revenue;
- Europe, Middle East, Africa: 26% or $9.3 billion of overall revenue;
- Greater China: 19% or $6.7 billion of overall revenue;
- Asia Pacific, Latin America: 14% or $5.0 billion of total revenue.
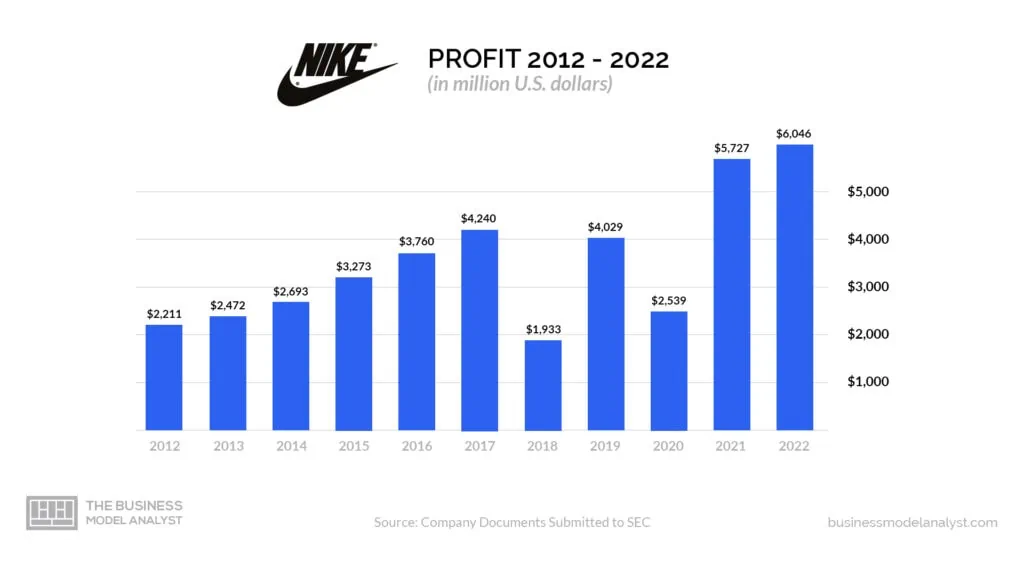
Nike’s net income in 2019 rose to $4 billion compared to 2018’s 1.93 billion, marking a 108% rise mainly due to revenue growth, a reduced effective tax rate, and an increase in the company’s gross margin. Due to this, Nike’s board of directors approved a higher dividend of 98 cents from 88 cents. Nike’s net income dropped tremendously to $2.5 billion in the 2020 fiscal year due to the COVID-19 pandemic.
The company’s income statement showed a rise in its EPS (earnings per share) by 114% to hit $2.55 in the 2019 fiscal year from $1.19 in the 2018 fiscal year. Nike’s earnings dropped to $1.63 per share in 2020.
Nike Expenses
Nike invests a large sum of money in promotional campaigns every year. For example, Nike’s promotional and advertising expenses for the 2022 financial year were around $3.11 billion. The company’s annual operating costs for the same year were $40.035 billion marking a 6.47% rise from the previous year. Annual operating costs for 2020 and 2021 were $34.288 billion and $37.601 billion, respectively.
Nike Profits
Nike’s gross profit for the quarter ending November 30 was $5.711B, while profit for 2022 was $21.479 billion, a 7.6% rise from 2021. The company’s gross profit for 2020 and 2021 was $16.241 billion and $19.962 billion, respectively.
Nike’s Potential for Profitability
Nike uses various strategies to maintain its potential for profitability. These are:
- Differentiation: This is Nike’s core generic strategy for developing business profitability and competitive advantage. The goal is to create products with unique qualities to set them ahead of their competitors;
- Differentiation focus: Nike targets buyers in the global sporting products industry. For example, Nike has specially designed shoes for football and soccer with exclusive studs. The company achieves such focus through thorough development and research;
- Cost leadership: Nike strives to reduce production costs to boost profit margins. By outsourcing to cheaper contract manufacturers.
Other strategies Nike uses to boost profitability include:
- Product development
- Market penetration
- Market development
- Diversification
Challenges that Nike Faces as a Business
Despite Nike’s success, the company is not immune to challenges other companies in the apparel industry face, with fewer consumers unwilling to spend their money on apparel. The company faces boycotts in China following the controversy over Xinjiang cotton. Analysts say this controversy may be responsible for the regional sales drop.
Nike may be forced to invest more money to increase demand in China. Competition in the apparel and sportswear industry is Nike’s core challenge. The availability of counterfeit products can also impact Nike’s reputation and revenue growth.
Conclusion
Despite Nike’s struggles, it has remained one of the most successful brands in the apparel and sportswear industry. With the strategies the company has put in place, its success will likely remain constant.