
Drivers pay a price gap that shrinks when the pump falls. Shippers pay through tables the carriers rewrote on the way up.
Americans have spent about $107 billion more on gasoline and diesel since the Iran war began on February 28 than they would have without it, according to an estimate from Brown University’s Climate Solutions Lab reported by The Wall Street Journal. Gasoline accounts for $59 billion of that and diesel for $48 billion. Spread across 199 days, the bill averages about $538 million a day.
The coverage treats that as one bill landing on one kitchen table. It is two bills, and they come with very different exit terms.
The gasoline half is a gap between a pump price and a counterfactual. When the pump falls, the gap shrinks, and no contract anywhere in your life remembers that regular cost $4.32 in September.
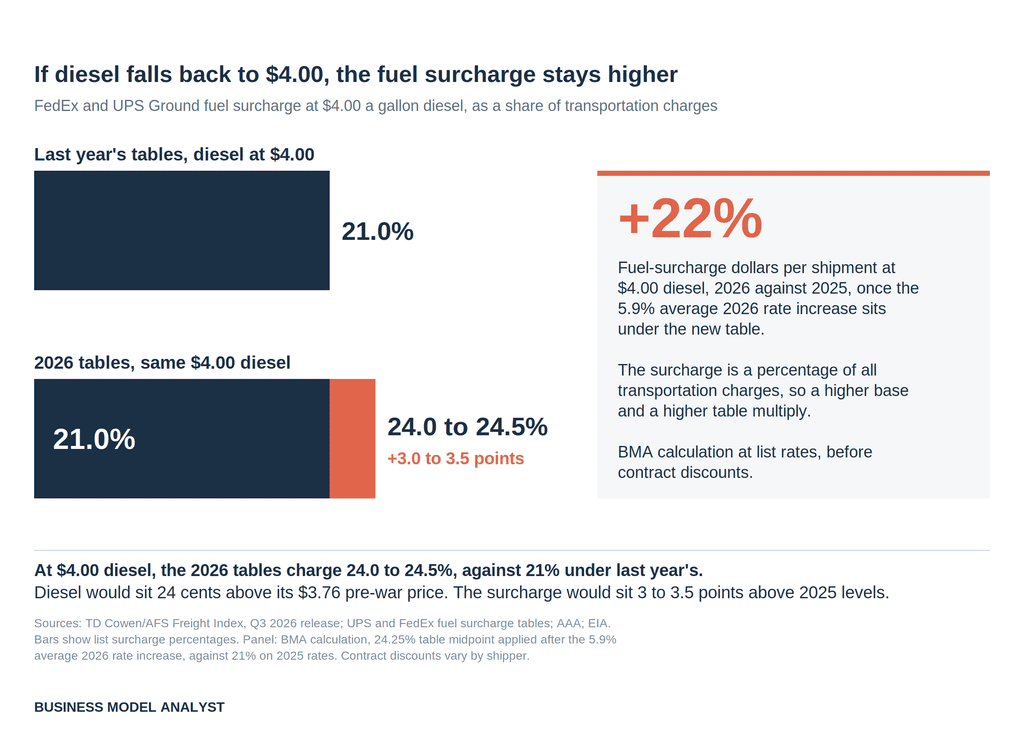
The diesel half mostly never touches a household pump. It moves through freight invoices, and the companies that write those invoices spent the spring and summer redrawing the tables that turn a diesel price into a surcharge. Under the new parcel tables, if diesel slid back to $4.00 tomorrow, shippers would still pay a fuel surcharge of 24.0% to 24.5% of their transportation charges. Under last year’s tables, the same $4.00 diesel meant 21%.
Your pump price has a memory of one week. A carrier’s surcharge table can hold on to a war for years.
What Happened
Brown’s Iran War Energy Cost Tracker has been climbing faster as the months go on. It showed about $20 billion by mid-April and more than $40 billion by May 18. By September 7 the tally sat near $100 billion and was adding roughly $1 million every two minutes, a pace of about $720 million a day, a third above the average since February. Divide today’s total by the 131 million households the tracker uses and you get about $817 each.
Prices explain the acceleration. The Energy Information Administration put on-highway diesel at $6.285 a gallon on September 14, the first national reading above $6 and $2.546 higher than a year earlier. Regular gasoline sat at $4.319, up $1.151. AAA had diesel at $6.27 on Tuesday, with California above $8, while diesel futures closed at a record $5.26 and Brent crude settled at $108.75.
The supply squeeze has several sources at once. Shipments through the Strait of Hormuz remain below prewar levels, Houthi militants are threatening tankers on the western side of the Arabian Peninsula, and a Ukrainian air campaign has disrupted much of Russia’s refining capacity.
Households are absorbing their share the old-fashioned way, by saving less. The personal saving rate hit 3.0% in July, according to the Bureau of Economic Analysis, down from 4.5% in January.
The Backstory
The method behind the $107 billion decides who counts as “Americans,” so it is worth a minute.
Brown’s team takes the daily gap between actual retail prices, from AAA and the EIA, and a no-war counterfactual built from the pre-war price and historical daily price movements. It multiplies that gap by EIA fuel demand and uses Census data to translate the total into household costs. The model does not adjust for people and companies buying less, so the WSJ notes the true figure could run slightly lower.
That demand caveat bites harder on diesel. In the four weeks to August 28, EIA data show gasoline product supplied at 8.9 million barrels a day, down 2% from a year earlier, while distillate came in at 3.7 million, down 6%. Diesel buyers are cutting back three times as hard as gasoline buyers, so the diesel half of the estimate carries the bigger overstatement.
Then look at the split. In that same EIA snapshot, diesel makes up about 29% of the combined gallons but 45% of Brown’s bill. Per gallon, diesel has risen 2.2 times as much as gasoline over the past year.
Most of that diesel is bought by businesses. The Commerce Department estimates consumers spent more than $400 billion on fuel last year, and that figure excludes businesses’ diesel costs. Brown’s own team explains the choice openly: they put diesel in the tracker because truckers, railroads and farms pass the cost on to shoppers. As a statement about who ends up paying, that holds. As a business lens, it skips the interesting part, which is the plumbing that carries the cost to the shelf and whether that plumbing ever lets it back out.
The household half is easy to size. Annualize the $59 billion gasoline premium and you get about $108 billion a year, around 0.46% of July’s disposable personal income of roughly $23.7 trillion. That covers about three-tenths of the 1.5-point drop in the saving rate since January. (BMA calculation. January carried unusually large tax refunds, which flatters the starting point.)
Gasoline premiums have one friendly property. Your employer doesn’t index your salary to them, and the station doesn’t lock you into last month’s price when the market drops.
The Plan
The carriers that move America’s parcels do have a contract for this, and they have been editing it all year.
FedEx and UPS charge ground fuel surcharges as a percentage of transportation charges, reset each week from the EIA’s national diesel average through a published table. The weekly moves get the attention. The table edits do the work.
UPS raised its table on March 9 for the 11th time in just under 30 months, according to FreightWise, after a long stretch in which tables changed about once a year. On April 13 it restructured the index again as diesel ran from $3.897 on March 2 to $5.643. The new tiers produced no sudden jump in the weekly rate. The effect shows up later, once prices come down. Then on August 10, per Loop’s carrier-pricing tracker, UPS moved the start of its lowest Ground bracket to $4.72 a gallon from $4.45, which slows the surcharge’s decline once diesel falls below about $4.90.
FedEx made table increases of its own. TD Cowen and AFS Logistics, in the Q3 release of their freight index, put the combined result in one line: at $4.00 diesel, shippers would still pay 24.0% to 24.5%, against 21% under last year’s tables. Net fuel surcharge per package rose 40% year over year in the second quarter, and the index’s ground parcel rate per package hit a record 42.4% above its January 2018 baseline.
The percentage also rides on top of everything else on the invoice. Parcel fuel surcharges apply to total transportation spend, including base rates that both carriers raised by an average of 5.9% for 2026. Stack the higher base under the higher table and the same $4.00 diesel produces about 22% more fuel-surcharge dollars per shipment than it did at 2025 list rates. (BMA calculation using the 24.25% table midpoint, before contract discounts. The range runs from 21% to 24%.)
Truckload freight uses a cruder version of the same machine: the current DOE diesel price minus a base price, divided by an assumed miles per gallon. On a common broker table with a $1.25 base and 6.0 mpg, today’s diesel produces a surcharge of about 84 cents a mile, double the 41 cents of a year ago. The assumed mpg works as a price term too. A carrier whose trucks get 7 mpg spends about 36 cents more per mile on fuel than last year and bills about 42 cents more, a 6-cent spread that widens as diesel climbs. (Illustrative arithmetic, not a fleet average.)
Farmers sit at the other end of the chain, with no surcharge, no table and harvest underway. USDA estimates farms spent $15.6 billion on fuel last year, $10 billion of it on diesel. A single combine burning 200 gallons a day over a 30-day harvest, the pattern one Missouri corn and soybean grower described in Associated Press reporting this month, runs about $15,000 above its pre-war fuel cost at today’s prices. A farm’s only index is the crop price, and USDA did lift its 2026 farm earnings forecast on stronger receipts for key crops.
The Business Model Angle
An index clause is a product, and the table is its price list. Shippers negotiate the base rate, fight over the discount and read the fuel line like a weather report. Carriers run it as a pricing surface with weekly repricing built in. In a calm year a table edit barely registers. In a shock year, shippers can’t separate the edit from the war, which makes a shock year the cheapest moment to make one.
Reprice in the bracket your customers aren’t paying. UPS’s August change touched the $4.45 to $4.72 band while national diesel traded above $5, so no shipper’s September invoice moved. The change waits in the part of the curve customers will cross on the way down. Our breakdown of Amazon’s ad auction surcharge found that fees migrate to the least observable line on a bill. A fuel table shows the same migration in time rather than in mechanism: the least observable bracket is the one you haven’t reached yet.
Pass-through belongs to whoever holds the pen. When diesel set its first record this month, we argued that pass-through is a contract term, not a market outcome. One layer down sits the real variable: who drafts the term and how often they get to revise it. A carrier that can edit a published table mid-year holds an option. A shipper that signed an annual agreement wrote that option for free. Big shippers can negotiate fixed tables or caps. Small ones take the list table and its timing.
Up fast, down slow is a design decision. We watched wholesale chicken prices collapse while grocery shelves barely moved. A fuel table with a raised floor puts that asymmetry in writing. If you sell any service with a cost-indexed line, the take rate you earn across a full cycle depends more on the shape of your table than on this week’s input price.
The Risk
The carriers’ best defense is that the tables recover more than the fuel a truck burns. A diesel spike raises what parcel networks pay for purchased linehaul and contractor delivery miles, and those costs don’t map neatly to a national pump average. FedEx’s chief customer officer told analysts last September that fuel surcharge index changes had helped per-package revenue in a pricing environment she described as competitive and rational. Carriers read that as cost recovery. Shippers read it as margin.
Competition also puts a ceiling on the ratchet. Regional and last-mile carriers such as OnTrac, GLS and Veho more than doubled their volumes from 2024 to 2025, according to Pitney Bowes data cited by AFS, and Amazon has opened its supply chain network to outside shippers. A table that stays high after diesel falls hands those rivals a sales pitch.
List tables aren’t what large shippers pay, either. Fuel surcharge discounts are a standard negotiating item, and the 22% calculation above applies to list rates. A shipper with a capped or fixed table may see none of it.
The absolute dollars still fall when diesel does. At $4.00, a shipper pays less fuel surcharge than at $6.29. The argument here concerns the level it falls to, and that level sits higher than it did a year ago.
Finally, the Brown figure is an estimate resting on a counterfactual. It ignores lower demand, which inflates it, and it ignores second-round costs such as freight and food prices, which push the other way. Treat $107 billion as a scale marker rather than an invoice.
Quick Questions
How much extra have Americans spent on fuel since the Iran war started? About $107 billion through mid-September, according to Brown University’s Climate Solutions Lab: roughly $59 billion on gasoline and $48 billion on diesel, or about $817 per household.
Why does the tracker count diesel if most people don’t buy it? Brown includes it because trucking, rail and farm fuel costs pass through to consumer prices. Businesses buy most of that diesel, so their freight contracts decide how long the cost lingers.
What is a fuel surcharge table? A published schedule that converts the weekly EIA diesel price into a surcharge percentage. Carriers can change the table itself, which moves the surcharge even when diesel stays flat.
Will shipping costs drop if diesel falls? Yes, but less than diesel. At $4.00 diesel, the 2026 FedEx and UPS Ground tables charge 24.0% to 24.5% of transportation charges, compared with 21% under last year’s tables.
Who can’t pass fuel costs on? Farms, owner-operators hauling spot loads without surcharge terms, and small shippers paying list rates carry the most exposure.
The Business Model Analyst Take
Every cost shock produces two numbers. One measures the price gap, and it heads toward zero when the shock ends. The other lives in contracts, and it goes wherever the people who draft those contracts send it.
Brown’s $107 billion is the first kind. For the gasoline half, that works: your household budget will recover at the speed of the pump. The diesel half runs through a stack of surcharge tables, and the carriers editing those tables used the one year when a war premium and a table premium look identical on an invoice.
If your business buys freight, pull your fuel surcharge schedule this week and price it at $4.00 diesel instead of $6.29, because that is the invoice you will be paying when the headlines move on. If your business sells anything with a cost-indexed line, study the UPS move from August. The revision that earns the most sits in the bracket your customers haven’t reached.