
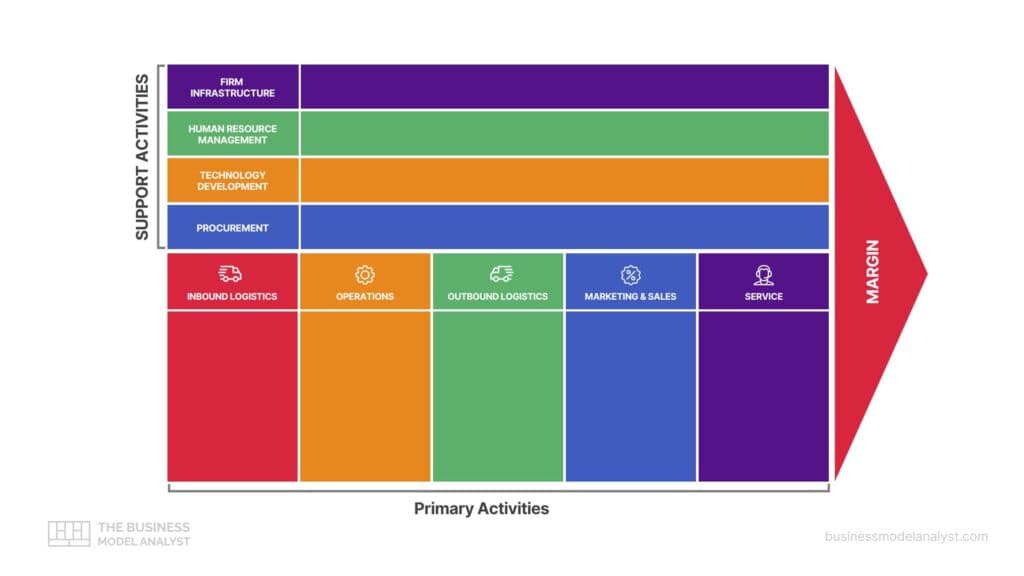

The Value Chain Analysis Template PDF is a free, print-ready sheet laid out the way Michael Porter drew it: five primary activities running left to right along the bottom, the support activities sitting above them, and margin at the end of the chain. Download it, print it, write in it. Below the file spec you also get a filling method and a worked example built from Eli Lilly’s 2025 accounts.
What’s in the download
- Format: PDF, free
- Layout: Porter’s value chain, with inbound logistics, operations, outbound logistics, marketing and sales, and service across the primary row, and the support activities above them
- Fillable fields: none. This is a print-and-write sheet, not a form. If you prefer to stay on screen, most PDF readers will let you drop comment boxes onto it
- Software needed: any PDF reader. No spreadsheet, no slide deck, no account with a whiteboard tool
That last line is the reason to take the PDF over a drawing tool. In Miro or Slides, a box grows to fit whatever you type into it, so the sheet quietly turns into an essay and the biggest box becomes the one whose owner talks the most. The PDF’s geometry is fixed. Every activity gets the same amount of room whether it is 40% of your cost base or 1%, and you have to choose what fits.
Who this is for, and when
You need this the week someone above you asks where the money actually goes. A consultant three days into a diagnostic with no cost model yet. An operations manager who has been told to find 5% and has to decide which activity to cut into. A founder writing the operations section of a plan and realising they have never separated what it costs to make the thing from what it costs to sell it. A student with a case study due and a company’s annual report open.
What’s on the sheet
The bottom row is the sequence a product moves through. Inbound logistics is everything arriving: suppliers, receiving, inventory. Operations is the transformation, whether that is a production line, a kitchen or a codebase. Outbound logistics is everything leaving: warehousing, distribution, delivery. Marketing and sales is demand creation and the act of closing. Service is what happens after the money changes hands: support, warranty, returns, success teams.
The row above holds the activities that touch all five: procurement, technology development, human resource management and firm infrastructure. They do not sit in the sequence because they feed every part of it. The wedge at the end is margin, which is not a box you fill in so much as the number the rest of the sheet has to explain.
How to fill it in
- Pick the unit before you pick up the pen. Porter’s own guidance is that a value chain belongs to a business unit, not a whole conglomerate. One product line, one region, one operating segment. A chain drawn for a holding company averages away the thing you were looking for.
- Pull the last full year of operating costs and write a percentage in every box. Not a description, a number. They have to sum to 100.
- Where your accounts lump two boxes together, write the lump across both and mark it. Most income statements will not separate marketing from administration, or inbound from outbound freight. Recording the lump honestly beats splitting it with a guess.
- Anything you cannot place goes in a leftover pile at the side of the sheet with its own percentage. Unallocated overhead is a finding, not a failure. If it is large, that is the first thing to go and investigate.
- Give every box a second mark: would a customer notice if you did this activity noticeably better? Yes, no, or unsure. Two boxes are now interesting. High cost with no customer notice is a candidate to standardise, automate or hand to someone else. Low cost with high customer notice is the thing you defend and fund.
- Draw arrows between boxes where a decision in one changes the cost of another. Cheaper inbound freight that raises scrap in operations. A service policy that lets sales promise more. The arrows are where the real money moves, and they are the reason to do this on one sheet of paper rather than in nine separate slides.
- Last, ask which box is the binding constraint on the whole business right now. It is frequently not the expensive one.
Worked example: Eli Lilly’s value chain in percentages, FY2025
Lilly reported $65,179M of revenue for 2025 and $26,302M of operating income, so the margin wedge holds 40.4%. Here is the rest of the sheet, with each reported cost line assigned to the boxes it covers. All figures come from the company’s fourth-quarter and full-year 2025 results, released 4 February 2026.
| Value chain box | FY2025 cost | Share of operating cost |
|---|---|---|
| Inbound logistics, operations and outbound logistics | $11,052M (cost of sales) | 28.4% |
| Technology development | $16,247M (R&D $13,337M plus acquired IPR&D $2,910M) | 41.8% |
| Marketing and sales, service and firm infrastructure | $11,094M (marketing, selling and administrative) | 28.5% |
| Restructuring and impairment | $484M | 1.2% |
| Total operating cost | $38,877M | 100% |
Look at what that does to the picture. Porter draws support activities as a thin band above the primary row, and the primary row as the big arrow that carries the product. At Lilly the thin band is the largest cost in the company. Technology development takes 41.8% of every operating dollar, more than making, moving and shipping the medicine combined. Redraw the boxes to scale and the standard diagram inverts.
Then run the constraint test, and it inverts again. Making the product is the cheap part at 28.4% of cost and roughly 17% of revenue, which is why gross margin reached 83.0% in 2025, up 1.7 points. Yet for two years the thing capping the company was not discovery, it was fill-finish capacity: revenue grew 45% while cost of sales grew 31%, and Lilly spent the year committing to a $6bn active ingredient plant in Alabama, a $3bn oral medicine facility in Europe and a new injectable and device site in Pennsylvania. The cheapest box on the sheet was the one deciding how much of the expensive box’s output could be sold. Mounjaro and Zepbound alone brought in $36,507M, 56% of revenue, and every dose of that had to be physically made.
One honest note on method, because it will happen to you too. Marketing, selling and administrative arrives as a single reported line, so three of Porter’s boxes have to share it. You cannot separate them from outside the company. Write the lump, mark it, and resist the urge to invent a split.
When a value chain analysis is the wrong tool
The framework assumes a sequence: things come in, get transformed, go out, get sold. Marketplaces and platforms break that assumption, because their value comes from matching two sides rather than from a chain, and the interesting costs sit in trust, liquidity and network effects that have no box here. Pre-revenue startups break it too, since there is no cost history to allocate. For either case, start with the Business Model Canvas. If the question you actually have is about rivals and supplier power rather than your own activities, that is Porter’s Five Forces, not this.
Related templates and further reading
- Value chain analysis examples for beginners: read this first if you want the framework explained before you fill anything in.
- Companies value chain analysis: the full library of worked company chains, useful as a model for how much detail belongs in each box.
- Amazon value chain analysis and Coca-Cola value chain analysis: pick these when your business owns its logistics or has handed a capital-heavy step to partners.
- Nike value chain analysis and Trader Joe’s value chain analysis: pick these when you outsource production, or when the retail chain has revenue nodes that are not on the shelf.
- Business Model Canvas Template PDF: use it before the value chain when you are still deciding what the business is.
- SWOT Analysis Template PDF and PESTLE Analysis Template PDF: the inside-out and outside-in views that pair with this one.
Frequently asked questions
Can I edit the value chain analysis template PDF? Not directly. The file has no form fields, so nothing types into it. Print it and write, or open it in a PDF reader that supports comment boxes and annotate on top. If you need a typed version for a report, rebuild the grid as a table in your document and use the printed sheet for the working session.
What is the difference between a value chain and a supply chain? A supply chain runs across companies and tracks goods moving from suppliers through you to customers. A value chain sits inside one business unit and tracks activities, including ones no product passes through, such as HR and firm infrastructure. Supply chain asks where things are. Value chain asks where value and cost accumulate.
How do I assign costs when my accounts do not track activities? Start with the categories you already report, assign each to the boxes it covers, and write a lump across several boxes rather than a guessed split. Put anything unassignable in a leftover pile with its own percentage. A rough allocation that sums to 100% is more useful than a precise one covering half the business.
Do the percentages really have to add up to 100? Yes, and that is the discipline. Boxes filled with adjectives always look balanced. Boxes filled with percentages force you to say that operations is four times procurement, and someone in the room will disagree loudly. That argument is the deliverable.
Is value chain analysis the same as Porter’s Five Forces? No. Both come from Porter, but the value chain looks inward at your own activities and where margin comes from, while Five Forces looks outward at industry structure: rivals, buyers, suppliers, entrants and substitutes. Run the value chain when the question is about your costs, Five Forces when it is about your industry.
Can I use this template for a service or software business? Yes, with relabelling. Inbound logistics becomes data, licences and cloud capacity coming in. Operations becomes engineering and delivery. Outbound logistics is often near zero, which is itself worth noting on the sheet. An empty or near-empty box in a service business is a real result, not a gap to pad out.