Definition Box
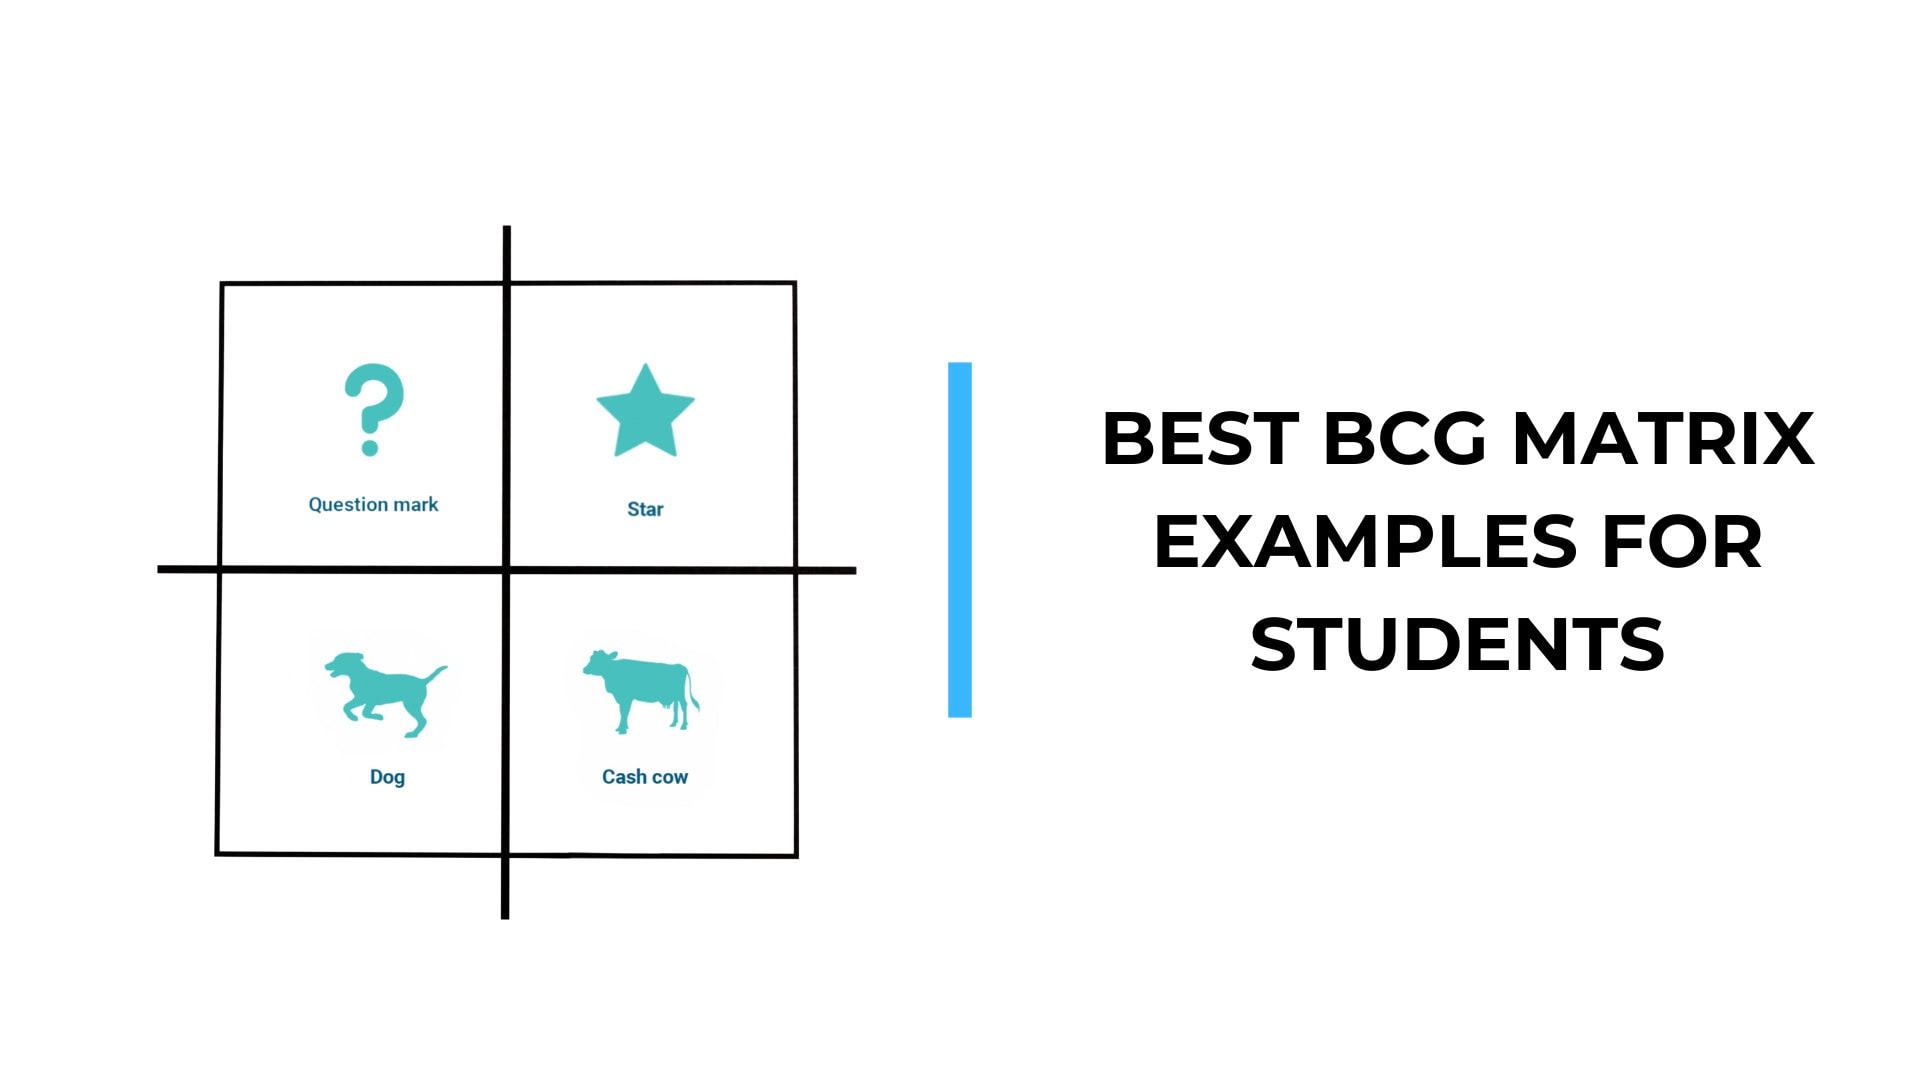
The Apple BCG Matrix sorts Apple’s product portfolio into four quadrants (Stars, Cash Cows, Question Marks, and Dogs) based on market growth rate and relative market share. The key takeaway for 2026: the popular claim that the iPhone is a “Star” is outdated. With the global smartphone market growing just 1.5% in 2025 (IDC), the iPhone is now a textbook Cash Cow, the largest one Apple owns at $209.6 billion in fiscal 2025. The real Star is Services, which grew 13.5% to a record $109.2 billion. Stars need a fast-growing market, and inside Apple, only Services still has one.
Most BCG analyses of Apple you will find online repeat the same line: iPhone is the Star, Mac and iPad are the Cash Cows, and the iPod is the Dog. That framing was reasonable a decade ago. It is wrong now, and the iPod has been discontinued since 2022, so leading with it tells you the analysis has not been updated. This breakdown uses Apple’s actual fiscal 2025 numbers, filed with the SEC, to place each business where the data says it belongs rather than where habit says it should go.
If you want the underlying framework first, our explainer on what the BCG Matrix is covers the mechanics. Here we apply it specifically to Apple, with the figures to back every placement.
How the BCG Matrix Works
The Boston Consulting Group built this tool in the early 1970s. It plots two variables and nothing else, which is both its strength and its weakness.
| Quadrant | Market growth | Relative market share | Strategic meaning |
|---|---|---|---|
| Star | High | High | Leader in a fast-growing market. Invest to defend the lead. |
| Cash Cow | Low | High | Leader in a mature market. Harvest the profit, fund everything else. |
| Question Mark | High | Low | Small player in a fast-growing market. Invest hard or exit. |
| Dog | Low | Low | Weak player in a flat market. Divest or wind down. |
The distinction people forget is that growth refers to the market, not the product. A product can post record revenue and still be a Cash Cow if the category around it has stopped expanding. That is exactly what has happened to the iPhone, and it is why so many Apple BCG analyses misclassify it.
The Data Foundation: Apple’s FY2025 Revenue by Segment
Before placing anything in a quadrant, here is what Apple actually earns and where the growth is. These figures come straight from Apple’s fiscal 2025 Form 10-K for the year ended September 27, 2025.
| Segment | FY2025 revenue | YoY change | Share of total |
|---|---|---|---|
| iPhone | $209.6 billion | +4.2% | 50.4% |
| Services | $109.2 billion | +13.5% | 26.2% |
| Wearables, Home and Accessories | $35.7 billion | -3.6% | 8.6% |
| Mac | $33.7 billion | +12.4% | 8.1% |
| iPad | $28.0 billion | +5.0% | 6.7% |
| Total | $416.2 billion | +6.4% | 100% |
Two numbers carry the whole analysis. Services grew at more than triple the rate of the iPhone and is now larger than Mac, iPad, and Wearables combined. And Wearables, the segment that holds the Apple Watch, was the only category that shrank. Hold those two facts in mind, because they overturn the conventional placement of half of Apple’s portfolio.
Why the iPhone Is No Longer a Star
This is the part most analyses get wrong, so it is worth being precise.
A Star requires high market growth and high share. The iPhone clearly has the share. Apple captured 20% of global smartphone shipments in 2025, up from 18% a year earlier, and led the category for the full year, according to Counterpoint Research. The problem is the growth side. Global smartphone shipments rose only about 1.5% in 2025 per IDC. That is not a high-growth market. It is a saturated one where Apple wins by taking share from rivals, not by riding a rising tide.
High share plus low market growth is the literal definition of a Cash Cow. So the iPhone, despite generating a September-quarter revenue record and more than half of all Apple revenue, sits in the Cash Cow quadrant in 2026. It is the most profitable Cash Cow in corporate history, but a Cash Cow nonetheless.
Calling it a Star feels right because the iPhone is glamorous and dominant. BCG placement does not care about glamour. It cares about whether the surrounding market is still expanding, and the smartphone market stopped doing that years ago.
Apple’s BCG Matrix: The Four Quadrants
Stars: Services
Services is the one Apple business that satisfies both Star conditions at once. The market for digital subscriptions, cloud storage, advertising, and app commerce is still growing fast, and Apple holds a commanding share of its own 2.5 billion-device installed base, a captive audience no competitor can reach.
| Star | FY2025 revenue | Growth signal | Why it qualifies |
|---|---|---|---|
| Services (App Store, iCloud, Apple Music, Apple TV+, advertising, payments) | $109.2 billion | +13.5% YoY, record high | Fast-growing market plus dominant share of a locked-in user base |
The economics are even better than the headline. Services gross margin reached roughly 75% in the September 2025 quarter, more than double the margin on hardware. A large slice of that profit is nearly free money: Google reportedly pays Apple around $20 billion a year to remain the default search engine in Safari, a payment that drops almost entirely to the bottom line. The App Store alone anchors an ecosystem that facilitated more than $1.3 trillion in developer billings and sales, a dynamic we unpack in our breakdown of the Apple App Store economy.
This is where Apple should keep investing, and it is. Services is the engine quietly reshaping the entire Apple business model from a hardware company into a recurring-revenue one.
Cash Cows: iPhone, Mac, and iPad
These are mature markets where Apple leads. They throw off the cash that funds buybacks, dividends, and every experimental bet the company makes.
| Cash Cow | FY2025 revenue | Market position | Market growth |
|---|---|---|---|
| iPhone | $209.6 billion | ~20% global share, premium-segment leader (Counterpoint) | Smartphone market up ~1.5% in 2025 (IDC) |
| Mac | $33.7 billion | Premium laptop leader, strong on Apple Silicon | Global PC market mature, low single-digit growth |
| iPad | $28.0 billion | Top tablet vendor, ~38% global share (Omdia, IDC) | Tablet shipments up ~10% in 2025, then cooling |
The Mac deserves a caveat. Its 12.4% revenue jump in FY2025 looks Star-like, but that surge came from the Apple Silicon upgrade cycle, not from an expanding PC market. The category itself is flat. When a mature market’s leader posts a good year on the back of a product refresh, that is a Cash Cow having a strong quarter, not a Star being born.
The iPad sits at the edge of the quadrant. Tablet shipments actually grew close to 10% in 2025 according to Omdia, a post-pandemic rebound that analysts expect to cool. Apple remains the clear leader, shipping 19.6 million iPads in the fourth quarter alone. Dominant share in a maturing market keeps the iPad firmly in Cash Cow territory, with a watch-this-space note on whether AI features reignite category growth.
Question Marks: Vision Pro and Apple Intelligence
High-growth markets where Apple is, for now, a minor player. These are the bets that could become Stars or could quietly join the Dogs.
| Question Mark | Status | Market opportunity | The risk |
|---|---|---|---|
| Vision Pro and spatial computing | Niche volume, $3,499 starting price | Spatial and mixed-reality computing projected to grow quickly | Unproven mass-market demand at a luxury price point |
| Apple Intelligence and on-device AI | Behind rivals, rebuilding Siri | Generative AI is the fastest-growing software category | Apple admitted it could not ship a competitive frontier model on time |
Vision Pro is the cleanest Question Mark in the portfolio. The category has real long-term potential, but unit volumes remain small and the price keeps it niche. Apple is investing heavily without yet knowing whether spatial computing becomes a platform or a curiosity.
Apple Intelligence is the higher-stakes Question Mark. The market is enormous and growing, but Apple is playing catch-up, a vulnerability we examine more fully in the Apple SWOT analysis. Whether this becomes a Star depends entirely on execution over the next two product cycles.
Dogs: Apple TV Hardware, HomePod, and the Graveyard
Low share in low-growth markets. Some are quietly maintained for ecosystem reasons; others have already been killed.
| Dog | Status | Why it lands here |
|---|---|---|
| Apple TV 4K (the box) | Active but minor | Streaming hardware dominated by cheaper Roku, Amazon Fire, and Google devices |
| HomePod | Active but minor | Smart-speaker share trails Amazon Echo and Google Nest |
| iPod | Discontinued May 2022 | Absorbed by the iPhone; historical Dog only |
| Apple Car (Project Titan) | Canceled February 2024 | A decade-long bet shut down before launch |
The Apple Car is the most instructive Dog because it never shipped. After roughly ten years of development, Apple canceled Project Titan in February 2024 and reassigned most of its roughly 2,000 staff toward AI, as TechCrunch and others reported. In BCG terms, it was a Question Mark that Apple judged would never reach the share needed to become a Star, so it cut the spending. That is the matrix working as intended.
Note what is not on this list. The iPod appears only as history. Any 2026 analysis that still presents the iPod as a live Dog is recycling a decade-old template rather than reading the current portfolio.
The Full Apple BCG Matrix at a Glance
| Product or segment | Quadrant | Anchor data point | Strategic action |
|---|---|---|---|
| Services | Star | +13.5% to $109.2B, ~75% gross margin | Invest aggressively |
| iPhone | Cash Cow | $209.6B, ~20% share, 1.5% market growth | Harvest, defend share |
| Mac | Cash Cow | $33.7B, +12.4% on Apple Silicon cycle | Maintain, milk margin |
| iPad | Cash Cow | $28.0B, ~38% share, maturing market | Maintain, monitor AI lift |
| Vision Pro | Question Mark | Niche volume, $3,499 price | Invest or pivot |
| Apple Intelligence | Question Mark | Behind rivals, large market | Invest hard, execute |
| Apple TV box | Dog | Trails Roku, Amazon, Google | Maintain for ecosystem only |
| HomePod | Dog | Trails Echo and Nest | Maintain for ecosystem only |
| Apple Car | Dog (killed) | Canceled Feb 2024 | Divested |
| iPod | Dog (retired) | Discontinued 2022 | Already exited |
Strategic Implications
Read as a whole, the matrix tells a clear story about where Apple’s money comes from and where it is going.
The iPhone and Services together generate 76.6% of revenue, yet they play opposite roles. The iPhone is the Cash Cow funding the present. Services is the Star building the future, and it does so at margins the hardware business cannot match. This is why Apple keeps deepening the ecosystem rather than chasing unit-share gains in a flat phone market. Each device sold is less a one-time sale than a subscription seed, a logic explored in Apple’s target market strategy.
The Cash Cows fund the Question Marks. Apple can afford to lose money on Vision Pro and to pay roughly a billion dollars a year licensing AI models because the iPhone and Mac throw off enough cash to absorb the bets. That is the BCG flywheel functioning exactly as designed: harvest the mature leaders, feed the high-growth gambles.
The Dogs reveal discipline. Killing the Apple Car cost Apple a decade and billions, but the company recognized a Question Mark that would never convert and cut it. Apple’s willingness to shut down a Dog is, paradoxically, a sign the portfolio is being managed rather than hoarded.
Limitations of the BCG Matrix for Apple
The matrix is a useful lens, not a verdict. Three weaknesses matter most when applied to Apple.
First, it ignores ecosystem effects. The Apple TV box is a Dog on its own numbers, but it exists to keep users inside an ecosystem that sells Services at 75% margins. A standalone Dog can be worth keeping for what it protects, something the two-axis model cannot capture. The same logic shows up across Apple’s competitive strategy, where individual products matter less than the lock-in they reinforce.
Second, it treats market share as a proxy for profit. Apple’s brand, pricing power, and roughly 90% iPhone retention let it earn outsized profit from modest unit share. The matrix would miss that entirely.
Third, market definition changes the answer. Is the iPhone competing in “smartphones” (flat) or “premium smartphones above $1,000” (still growing)? Draw the boundary differently and the iPhone could arguably slide back toward Star territory. The model is only as honest as the market definition you feed it, which is why analysts who want the iPhone to be a Star can always redraw the lines to get there.
For comparison, the same tensions show up when you run the framework on other giants. Our Amazon BCG Matrix and Starbucks BCG Matrix analyses show how ecosystem and brand effects bend the quadrants in similar ways.
Frequently Asked Questions
Is the iPhone a Star or a Cash Cow in Apple’s BCG Matrix? In 2026, the iPhone is a Cash Cow, not a Star. It holds a dominant ~20% global share, but the smartphone market grew only about 1.5% in 2025. High share in a low-growth market is the definition of a Cash Cow. The iPhone generated $209.6 billion in fiscal 2025, the largest Cash Cow in the portfolio.
What is Apple’s Star in the BCG Matrix? Services is Apple’s clearest Star. It grew 13.5% to a record $109.2 billion in fiscal 2025, combining a fast-growing market (digital subscriptions, cloud, advertising, app commerce) with dominant share of Apple’s 2.5 billion-device installed base.
What are Apple’s Dogs in the BCG Matrix? The Apple TV hardware box and the HomePod are current Dogs, holding low share in markets dominated by cheaper rivals. The Apple Car (Project Titan), canceled in February 2024, and the iPod, discontinued in 2022, are retired examples.
Why isn’t the iPod in the matrix anymore? Apple discontinued the iPod in May 2022. It only appears in current analyses as a historical Dog. Any 2026 breakdown that treats it as a live product is using an outdated template.
What is Apple’s biggest Question Mark? Vision Pro (spatial computing) and Apple Intelligence (generative AI) are the two main Question Marks. Both sit in fast-growing markets where Apple currently holds little share, and both require heavy investment with uncertain payoffs.
Does the BCG Matrix accurately describe Apple? Only partially. It captures growth and share well but ignores ecosystem lock-in, brand-driven profitability, and the way market definition can flip a product between quadrants. It works best as one input among several, not a standalone strategy.
The Business Model Analyst Take
The most useful thing the BCG Matrix does for Apple in 2026 is expose a lazy consensus. Almost every analysis still files the iPhone under Stars because that is where it sat in 2014. The numbers say otherwise. A market growing 1.5% a year does not produce Stars, it produces Cash Cows, and the iPhone is the richest one ever built.
That reframing matters because it points to the real story of Apple’s portfolio: the company is mid-transition from a hardware business with a services attachment to a services business with a hardware moat. Services is the Star carrying the next decade of growth and margin, while the iPhone quietly funds the journey. The Question Marks, Vision Pro and AI, will decide whether Apple gets a second Star or spends the 2030s living off the same Cash Cow it has milked since 2014.
Apple’s discipline with its Dogs is the underrated signal here. A company that will spend ten years and billions on a car, then kill it cleanly when the math fails, is one that actually uses portfolio logic rather than ego. That is rarer than it sounds, and it is most of why Apple keeps converting maturity into cash instead of decline.